
Concept explainers
Videos
a.
The number of tumor cells present at diagnosis.
b.
To graph:
The graph of the function both before and after chemotherapy if patients receives the chemotherapy after the tumor has grown for
Solution:
The graph of the function both and before chemotherapy is:
Explanation:
Given information:
A very aggressive tumor is growing according to the function
Calculation:
The number of tumor cells at
After chemotherapy
So the
Hence the remaining tumor cells are
Here use
So take time
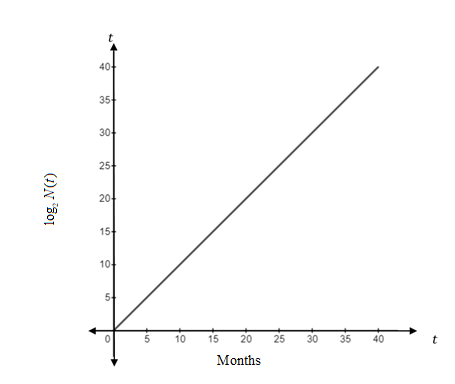
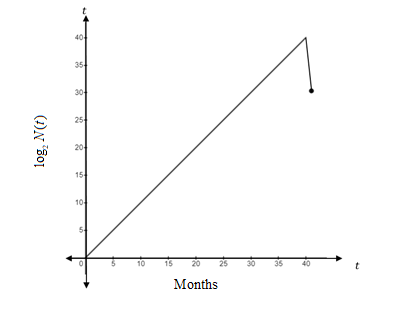
The tumor is continues grow for first
After chemotherapy, the cells are
Thus,
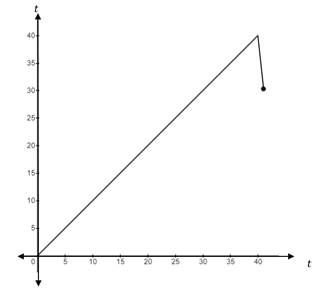
Hence after chemotherapy the graph look like as below:
c.
The discontinuous point in graph of part (b).
Want to see the full answer?
Check out a sample textbook solution
Chapter 3 Solutions
Calculus For The Life Sciences


- A Population of Foxes A breeding group of foxes is introduced into a protected area, and the population growth follws a logistic pattern. After t years, the population of foxes is given by N=37.50.25+0.76t foxes. a. How many foxes were intorduced into the protected area? b. Make a graph of N versus t and explain in words how the populatoin of foxes increases with time. c. When will the fox population reach 100 individuals?arrow_forwardDecay of Litter Litter such as leaves falls to the forest floor, where the action of insects and bacteria initiates the decay process. Let A be the amount of litter present, in grams per square meter, as a function of time t in years. If the litter falls at a constant rate of L grams per square meter per year, and if it decays at a constant proportional rate of k per year, then the limiting value of A is R=L/k. For this exercise and the next, we suppose that at time t=0, the forest floor is clear of litter. a. If D is the difference between the limiting value and A, so that D=RA, then D is an exponential function of time. Find the initial value of D in terms of R. b. The yearly decay factor for D is ek. Find a formula for D in term of R and k. Reminder:(ab)c=abc. c. Explain why A=RRekt.arrow_forwardWater Flea F. E Smith has reported on population growth of the water flea. In one experiment, he found that the time t, in days, required to reach a population of N is given by the relation e0.44t=NN0(228N0228N)4.46. Here N0 is the initial population size. If the initial population size is 50, how long is required for the population to grow to 125?arrow_forward
 Functions and Change: A Modeling Approach to Coll...AlgebraISBN:9781337111348Author:Bruce Crauder, Benny Evans, Alan NoellPublisher:Cengage Learning
 Algebra & Trigonometry with Analytic GeometryAlgebraISBN:9781133382119Author:SwokowskiPublisher:Cengage
 Algebra and Trigonometry (MindTap Course List)AlgebraISBN:9781305071742Author:James Stewart, Lothar Redlin, Saleem WatsonPublisher:Cengage Learning
 College AlgebraAlgebraISBN:9781305115545Author:James Stewart, Lothar Redlin, Saleem WatsonPublisher:Cengage Learning