Concept explainers
Videos
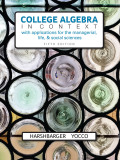
Energy Use The following table shows the energy use per dollar of GDP, as a percent, for years from 2000 and projected to 2035. (GDP, gross domestic product, is the monetary value of all the finished goods and services produced within a country’s borders in a specific time period, though GDP is usually calculated on an annual basis. It includes all of private and public consumption, government outlays, investments, and exports less imports that occur within a defined territory.) These data are indexed to 1980, which means that energy use for any year is viewed as a percent of the use per dollar of GDP in 1980.
a. Find a quadratic function that models these data, with x equal to the number of years after 2000 and y equal to the energy use per dollar of GDP, as a percent of the energy use per dollar of GDP in 1980. Report the model with three significant digits.
b. Graph the model and the data on the same axes.
c. Use technology to find when this model predicts that energy use per dollar of GDP will reach a minimum.
Energy Use per Dollar of GDP Indexed to 1980
(Source: U.S. Department of Energy)
Want to see the full answer?
Check out a sample textbook solution
Chapter 3 Solutions
College Algebra in Context with Applications for the Managerial Life and Social Sciences (5th Edition)


 Discrete Mathematics and Its Applications ( 8th I...MathISBN:9781259676512Author:Kenneth H RosenPublisher:McGraw-Hill Education
 Mathematics for Elementary Teachers with Activiti...MathISBN:9780134392790Author:Beckmann, SybillaPublisher:PEARSON
 Thinking Mathematically (7th Edition)MathISBN:9780134683713Author:Robert F. BlitzerPublisher:PEARSON
 Discrete Mathematics With ApplicationsMathISBN:9781337694193Author:EPP, Susanna S.Publisher:Cengage Learning,
 Pathways To Math Literacy (looseleaf)MathISBN:9781259985607Author:David Sobecki Professor, Brian A. MercerPublisher:McGraw-Hill Education