
APPLICATIONS+INVESTIGATIONS IN EARTH
18th Edition
ISBN: 9781533902405
Author: Tarbuck
Publisher: Hayden-McNeil Publishing
expand_more
expand_more
format_list_bulleted
Textbook Question
Chapter 3.7A, Problem 2A
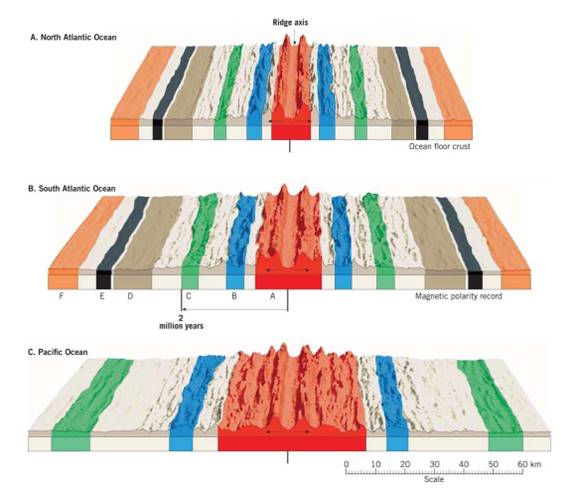
Using the South Atlantic as an example, label the beginning of the normal polarity period C that began 2 million years ago on the left sides of the Pacific and North Atlantic diagrams.
Expert Solution & Answer

Learn your wayIncludes step-by-step video

schedule06:22
Students have asked these similar questions
12
f10
F8
F6
[2
$ Time Period (t).
3.
Time Series Value
F16
F14
12
f10
F8
F4
F2
Time Period (t).
Select your answer
What type of pattern exists in the data?
- Select your answer -
b. Develop the linear trend equation for this time series (to 1 decimal).
T =
+
c. What is the forecast for t = 6 (to 1 decimal)?
Intercept
Time
Coefficients -
2873
55.1
What is the forecast for period 66, if period 66 is a Q1? (please round your answer to 1 decimal place)
Please see image for question as this has a three part answer.
A. ? million
B. ? million
C. ?
Chapter 3 Solutions
APPLICATIONS+INVESTIGATIONS IN EARTH
Ch. 3.1 - Using an atlas or Figure 3.11 for reference, draw...Ch. 3.1 - Use an atlas or your textbook to label the...Ch. 3.2 - Does Figure 3.3A represent a convergent or...Ch. 3.2 - Does Figure 3.38 represent a convergent,...Ch. 3.2 - Does Figure 3.3e represent a convergent,...Ch. 3.3A - Examine the east coast of South America and the...Ch. 3.3A - Examine the east coast of South America and the...Ch. 3.3A - On separate pieces of tracing paper, sketch the...Ch. 3.3B - Using the same two pieces of tracing paper you...Ch. 3.3B - Reassemble the two continents as you did in...
Ch. 3.5 - Figure 3.8 illustrates an idealized distribution...Ch. 3.5 - Figure 3.8 illustrates an idealized distribution...Ch. 3.5 - On Figure 3.8, outline the zone of earthquakes.Ch. 3.5 - Draw a line on Figure 3.8 at a depth of 100...Ch. 3.5 - The elastic rebound theory predicts that...Ch. 3.6 - How many intervals3, 5, or 7of reverse polarity...Ch. 3.6 - Approximately how many years ago did the current...Ch. 3.6 - Did Earth experience normal or reverse polarity...Ch. 3.6 - Did the period of normal polarity, C, bigin 1, 2,...Ch. 3.6 - During the past 4 million years, has each interval...Ch. 3.6 - Based on the pattern of magnetic reversals shown...Ch. 3.7A - On Figure 3.10, identify and mark the periods of...Ch. 3.7A - Using the South Atlantic as an example, label the...Ch. 3.7A - Using the distance scale at the bottom of Figure...Ch. 3.7A - The distances you obtained in Question 3 are for...Ch. 3.7B - North Atlantic: distance =km100,000cm/km=cm Rate...Ch. 3.7B - Pacific: distance =km100,000cm/km=cm Rate of...Ch. 3.7C - Using Figure 3.2, measure the distance from Point...Ch. 3.7C - Divide the distance in centimeters separating the...Ch. 3.7C - Repeat the procedure above to determine the age of...Ch. 3.7C - Based on your answers to Questions 2 and 3, which...Ch. 3.8 - What are the minimum and maximum ages of the...Ch. 3.8 - What is the approximate distance in kilometers...Ch. 3.8 - Using the data in Questions 1 and 2, calculate the...Ch. 3 - The distribution of earthquakes defines the...Ch. 3 - Prob. 2LRCh. 3 - Prob. 3LRCh. 3 - Prob. 4LRCh. 3 - Prob. 5LRCh. 3 - Prob. 6LRCh. 3 - Prob. 7LRCh. 3 - Prob. 8LRCh. 3 - Complete the block: diagrams in Figure 3.12 to...Ch. 3 - Prob. 10LRCh. 3 - List and explain two lines of evidence from this...
Additional Business Textbook Solutions
Find more solutions based on key concepts
Why does your soft drink can “sweat” more in the summer than in the winter?
Exercises for Weather & Climate (9th Edition)
Name the components (including muscles) of the thoracic cage. List the contents of the thorax.
Human Physiology: An Integrated Approach (8th Edition)
A variety of pea plant called Blue Persian produces a tall plant with blue seeds. A second variety of pea plant...
Genetic Analysis: An Integrated Approach (3rd Edition)
Thermite mixtures are used for certain types of welding, and the thermite reaction is highly exothermic. Fe2O3(...
General Chemistry: Principles and Modern Applications (11th Edition)
A 50-kg parachutist descends at a steady 40 km/h. What force does air exert on the parachute?
Essential University Physics: Volume 1 (3rd Edition)
The data were obtained from a use-dilution test comparing four disinfectants against Salmonella choleraesuis. G...
Microbiology: An Introduction
Knowledge Booster

Similar questions
- Consider the following time series data: Compute MSE using the most recent value as the forecast for the next period. What is the forecast for month 8? Compute MSE using the average of all the data available as the forecast for the next period. What is the forecast for month 8? Which method appears to provide the better forecast?arrow_forwardConsider the following time series data: Construct a time series plot. What type of pattern exists in the data? Use a multiple regression model with dummy variables as follows to develop an equation to account for seasonal effects in the data: Qtr1 = 1 if quarter 1, 0 otherwise; Qtr2 = 1 if quarter 2. 0 otherwise; Qtr3 = 1 if quarter 3, 0 otherwise. Compute the quarterly forecasts for next year based on the model you developed in part (b). Use a multiple regression model to develop an equation to account for trend and seasonal effects in the data. Use the dummy variables you developed in part (b) to capture seasonal effects and create a variable t such that t = 1 for quarter 1 in year 1, t = 2 for quarter 2 in year 1, … t = 12 for quarter 4 in year 3. Compute the quarterly forecasts for next year based on the model you developed in part (d). Is the model you developed in part (b) or the model you developed in part (d) more effective? Justify your answer.arrow_forwardIn Elliott Wave Analysis, a full cycle is made up of how many waves? a. Impulse waves only b. 8 c. 3 d. 5arrow_forward
- Consider the following time series: a. Construct a time series plot. What type of pattern exists in the data? Is there an indication of a seasonal pattern? b. Use a multiple linear regression model with dummy variables as follows to develop an equation to account for seasonal effects in the data: Qtr1 = 1 if quarter 1, 0 otherwise; Qtr2 = 1 if quarter 2, 0 otherwise; Qtr3 = 1 if quarter 3, 0 otherwise. c. Compute the quarterly forecasts for next year.arrow_forwardThe following 20 observations are for two quantitative variables, x and y. a. Create a scatter chart for these 20 observations. b. Fit a linear trendline to the 20 observations. What can you say about the relationship between the two quantitative variables?arrow_forwardHow to choose a base year for horizontal analysis?arrow_forward
- Problems 1 and 2 used different forecasting methods. Which method appears to provide the more accurate forecasts for the historical data? Explain. Consider the following time series data: Using the naïve method (most recent value) as the forecast for the next week, compute the following measures of forecast accuracy: Mean absolute error Mean squared error Mean absolute percentage error What is the forecast for week 7? Refer to the time series data in Problem 1. Using the average of all the historical data as a forecast for the next period, compute the following measures of forecast accuracy: Mean absolute error Mean squared error Mean absolute percentage error What is the forecast for week 7?arrow_forwardThe long-term direction indicated by a time series is known as the Select one:Regular DirectionTrendSeasonal DirectionLong-Term Cyclearrow_forwardIn the following table the activities with their precedence sequence and expected time (days) are listed for a project: a) The activities on the critical path are A-C-F-G-I A-B-D-H-I A-B-E-G-I Activity Immediate Predecessor(s) A A A B IT B C E, F D G, H BCDEFGH Time (days) 5 Ô CN ơi ơi ơT ANOT 2 4 5 5 5 2 3 6arrow_forward
- (4) Air at 100kPa, 295K and moving at m 710 is decelerated isentropically to S m 250. Determine the final static S temperature and static pressure. [515 K, 702kPa]arrow_forwardConsider the radiation with the following wavelengths: 1. 600 nm II. 200 nm III. 1200 nm Arrange by: LOWEST energy LOWEST frequency HIGHEST energy_ ergy_||| A. I, I, III B. II, II, I C. III, III, I D. III, II, II E. II, II, III 20arrow_forwardFour long, parallel conductors carry equal currents of = 1.00 A. The figure below is an end view of the conductors. The current direction is into the page at points A and B and out of the page at C and D. A × C B(x (a) Calculate the magnitude of the magnetic field at point P, located at the center of the square of edge length = 0.200 m. μεarrow_forward
arrow_back_ios
SEE MORE QUESTIONS
arrow_forward_ios
Recommended textbooks for you
 Essentials of Business Analytics (MindTap Course ...StatisticsISBN:9781305627734Author:Jeffrey D. Camm, James J. Cochran, Michael J. Fry, Jeffrey W. Ohlmann, David R. AndersonPublisher:Cengage Learning
 Principles of Accounting Volume 2AccountingISBN:9781947172609Author:OpenStaxPublisher:OpenStax College
 Cornerstones of Financial AccountingAccountingISBN:9781337690881Author:Jay Rich, Jeff JonesPublisher:Cengage Learning
Essentials of Business Analytics (MindTap Course ...
Statistics
ISBN:9781305627734
Author:Jeffrey D. Camm, James J. Cochran, Michael J. Fry, Jeffrey W. Ohlmann, David R. Anderson
Publisher:Cengage Learning
Principles of Accounting Volume 2
Accounting
ISBN:9781947172609
Author:OpenStax
Publisher:OpenStax College
Cornerstones of Financial Accounting
Accounting
ISBN:9781337690881
Author:Jay Rich, Jeff Jones
Publisher:Cengage Learning