
APPLICATIONS+INVESTIGATIONS IN EARTH
18th Edition
ISBN: 9781533902405
Author: Tarbuck
Publisher: Hayden-McNeil Publishing
expand_more
expand_more
format_list_bulleted
Textbook Question
Chapter 3.7A, Problem 3A
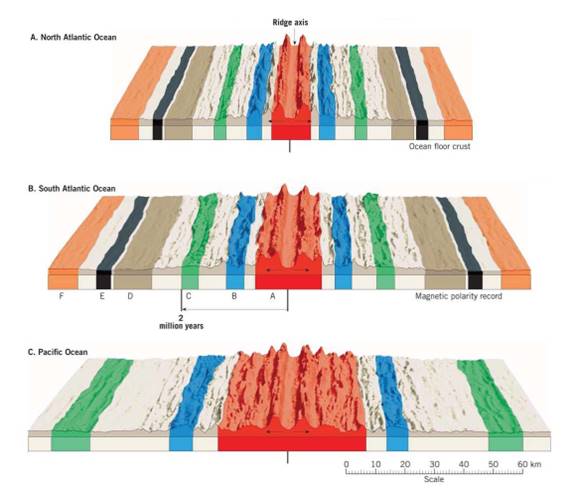
Using the distance scale at the bottom of Figure 3.10, measure the distance from the ridge axis to the beginning of the normal polarity period C for each ridge. Place the distances on Figure 3.10. How many kilometers has the left side of each of these ocean basins spread during the past 2 million years?
South Atlantic basin: ________km
North Atlantic basin: ________km
Pacific basin: ___________km
Expert Solution & Answer

Learn your wayIncludes step-by-step video

schedule08:54
Students have asked these similar questions
How much is the NOLCO in Year B?
How much is the NOLCO in Year C?
How much is the NOLCO in Yeat E?
ind each Poisson probability, using a mean arrival rate of 10 arrivals per hour. (a) Seven arrivals. (Round your answer to 4 decimal places.) Poisson probability (b) Three arrivals. (Round your answer to 4 decimal places.) Poisson probability (c) Fewer than five arrivals. (Round your answer to 4 decimal places.) Poisson probability (d) At least 11 arrivals. (Round your answer to 4 decimal places.) Poisson probability
I drag a stick at 2 m/s through an extremely shallow rectangular box filled with oil, creating a shock wave. I measure the angle made by the wave with the line along which the stick isdragged to be 45°. What is the speed of surface waves in this box?
Chapter 3 Solutions
APPLICATIONS+INVESTIGATIONS IN EARTH
Ch. 3.1 - Using an atlas or Figure 3.11 for reference, draw...Ch. 3.1 - Use an atlas or your textbook to label the...Ch. 3.2 - Does Figure 3.3A represent a convergent or...Ch. 3.2 - Does Figure 3.38 represent a convergent,...Ch. 3.2 - Does Figure 3.3e represent a convergent,...Ch. 3.3A - Examine the east coast of South America and the...Ch. 3.3A - Examine the east coast of South America and the...Ch. 3.3A - On separate pieces of tracing paper, sketch the...Ch. 3.3B - Using the same two pieces of tracing paper you...Ch. 3.3B - Reassemble the two continents as you did in...
Ch. 3.5 - Figure 3.8 illustrates an idealized distribution...Ch. 3.5 - Figure 3.8 illustrates an idealized distribution...Ch. 3.5 - On Figure 3.8, outline the zone of earthquakes.Ch. 3.5 - Draw a line on Figure 3.8 at a depth of 100...Ch. 3.5 - The elastic rebound theory predicts that...Ch. 3.6 - How many intervals3, 5, or 7of reverse polarity...Ch. 3.6 - Approximately how many years ago did the current...Ch. 3.6 - Did Earth experience normal or reverse polarity...Ch. 3.6 - Did the period of normal polarity, C, bigin 1, 2,...Ch. 3.6 - During the past 4 million years, has each interval...Ch. 3.6 - Based on the pattern of magnetic reversals shown...Ch. 3.7A - On Figure 3.10, identify and mark the periods of...Ch. 3.7A - Using the South Atlantic as an example, label the...Ch. 3.7A - Using the distance scale at the bottom of Figure...Ch. 3.7A - The distances you obtained in Question 3 are for...Ch. 3.7B - North Atlantic: distance =km100,000cm/km=cm Rate...Ch. 3.7B - Pacific: distance =km100,000cm/km=cm Rate of...Ch. 3.7C - Using Figure 3.2, measure the distance from Point...Ch. 3.7C - Divide the distance in centimeters separating the...Ch. 3.7C - Repeat the procedure above to determine the age of...Ch. 3.7C - Based on your answers to Questions 2 and 3, which...Ch. 3.8 - What are the minimum and maximum ages of the...Ch. 3.8 - What is the approximate distance in kilometers...Ch. 3.8 - Using the data in Questions 1 and 2, calculate the...Ch. 3 - The distribution of earthquakes defines the...Ch. 3 - Prob. 2LRCh. 3 - Prob. 3LRCh. 3 - Prob. 4LRCh. 3 - Prob. 5LRCh. 3 - Prob. 6LRCh. 3 - Prob. 7LRCh. 3 - Prob. 8LRCh. 3 - Complete the block: diagrams in Figure 3.12 to...Ch. 3 - Prob. 10LRCh. 3 - List and explain two lines of evidence from this...
Additional Business Textbook Solutions
Find more solutions based on key concepts
Enter the correct parcel temperatures and parcel dew points to complete Table 6-4. (Assume that the WALR = 5°C/...
Exercises for Weather & Climate (9th Edition)
As the warm front passes Point B, will the temperature rise or fall? __________________
Applications and Investigations in Earth Science (8th Edition)
18.8 The first stage of treatment at the reverse osmosis plant in Carlsbad, California, is to flow the water th...
Chemistry: The Central Science (13th Edition)
HOW DO WE KNOW? In this chapter, we have focused on genetic systems present in bacteria and on the viruses that...
Concepts of Genetics (12th Edition)
Is there any limit to the temperature you can achieve by focusing sunlight? (Hint: Think about the second law o...
Essential University Physics: Volume 2 (3rd Edition)
Community ecologists develop models or hypotheses to describe community structure and the factors that contribu...
Study Guide for Campbell Biology
Knowledge Booster

Similar questions
- The following table shows an example of gross domestic product values for five countries over six years in equivalent U.S. dollars (). a. How could you improve the readability of this table? b. The file GDPyears contains sample data from the United Nations Statistics Division on 30 countries and their GDP values from Year 1 to Year 6 in US. Create a table that provides all these data for a user. Format the table to make it as easy to read as possible. Hint: It is generally not important for the user to know GDP to an exact dollar figure. It is typical to present GDP values in millions or billions of dollars.arrow_forwardSouth Shore Construction builds permanent docks and seawalls along the southern shore of Long Island, New York. Although the firm has been in business only five years, revenue has increased from $308,000 in the first year of operation to $1,084,000 in the most recent year. The following data show the quarterly sales revenue in thousands of dollars: Construct a time series plot. What type of pattern exists in the data? Use a multiple regression model with dummy variables as follows to develop an equation to account for seasonal effects in the data: Qtr1 = 1 if quarter I, 0 otherwise; Qtr2 = 1 if quarter 2, 0 otherwise; Qtr3 = 1 if quarter 3, 0 otherwise. Based on the model you developed in part (b), compute estimates of quarterly sales for year 6. Let Period = 1 refer to the observation in quarter 1 of year 1; Period = 2 refer to the observation in quarter 2 of year 1; … and Period = 20 refer to the observation in quarter 4 of year 5. Using the dummy variables defined in part (b) and the variable Period, develop an equation to account for seasonal effects and any linear trend in the time series. Based on the seasonal effects in the data and linear trend estimated in part (c), compute estimates of quarterly sales for year 6. Is the model you developed in part (b) or the model you developed in part (d) more effective? Justify your answer.arrow_forwardConsider the following time series data: Construct a time series plot. What type of pattern exists in the data? Use a multiple regression model with dummy variables as follows to develop an equation to account for seasonal effects in the data: Qtr1 = 1 if quarter 1, 0 otherwise; Qtr2 = 1 if quarter 2. 0 otherwise; Qtr3 = 1 if quarter 3, 0 otherwise. Compute the quarterly forecasts for next year based on the model you developed in part (b). Use a multiple regression model to develop an equation to account for trend and seasonal effects in the data. Use the dummy variables you developed in part (b) to capture seasonal effects and create a variable t such that t = 1 for quarter 1 in year 1, t = 2 for quarter 2 in year 1, … t = 12 for quarter 4 in year 3. Compute the quarterly forecasts for next year based on the model you developed in part (d). Is the model you developed in part (b) or the model you developed in part (d) more effective? Justify your answer.arrow_forward
- Which technique is the most accurate to measure the distance? O Pacing O Taping Measurement Wheel EDM Question 12 6 pts A road centerline gradient falls from sta 10+00, elevation-300 ft, to station 15+00 at a range of 1%. What is the elevation (ft) at station 15+00? O 295 285 300 O 290 O O O Oarrow_forwardDetermine the following (1–18) measures for 20Y2, rounding to one decimal place, except the dollar amount, which should be rounded to the nearest cent. Use the rounded answer to the requirement for subsequent requirements, if required. Assume 365 days a year. Show each formula and calculation on the worksheet. amount which should be rounded to the nearest cent. use the rounded answer to the requirment for subsequent requirements, if required. Assume 365 days a year. Formula Calculation and Answer 1 Working Capital Stargel Inc. 2 Current ratio Comparative Retained Earnings Statement 3 Quick ratio For the Years Ended December 31, 20Y2 and 20Y1 4 Accounts receivable turnover 20Y2 20Y1 5 Number of days' sales in receivables days Retained…arrow_forwardGiven the following historical data, what is the moving average forecast for period 6 based on the last three periods? Period 1 2 3 4 5 Value 63 69 69 63 77 (Round your answers to 2 decimal places.) 3 Period Moving Average Forecast Last Value Forecastarrow_forward
- Consider the following time series: a. Construct a time series plot. What type of pattern exists in the data? Is there an indication of a seasonal pattern? b. Use a multiple linear regression model with dummy variables as follows to develop an equation to account for seasonal effects in the data: Qtr1 = 1 if quarter 1, 0 otherwise; Qtr2 = 1 if quarter 2, 0 otherwise; Qtr3 = 1 if quarter 3, 0 otherwise. c. Compute the quarterly forecasts for next year.arrow_forwardIntercept Time Coefficients - 2873 55.1 What is the forecast for period 66, if period 66 is a Q1? (please round your answer to 1 decimal place)arrow_forwardBalance the scale. How many more grams do you need? Use the equation editor to enter the answer. Enter the answer as a whole number with no decimal. 1300 g 1 kgarrow_forward
- If you are calculating the simple interest and you are given the time in months. How can you find the time in years? * O multiply 12 times the months divide 12 by the months O change the months to a decimal O divide the months by 12arrow_forwardMay I ask for an explanation and solution to the question for a better understanding. Thank you! 13. What is the Sculler's acid test ratio at December 31, 2021? a. 0.672 to 1 b. 0.756 to 1 c. 1.000 to 1 d. 1.767 to 1arrow_forward3.1 What is the minimum possible thickness of a soap bubble suppose it looks green (λ=500nm) when viewed at an angle of 45 degrees from the surface normal of the bubble? What is its color when viewed from the surface normal direction? Why the color looks grey before a soap bubble breaks? Suppose soap water has a refractive index of n=1.33 for all wavelengths of light. Naarrow_forward
arrow_back_ios
SEE MORE QUESTIONS
arrow_forward_ios
Recommended textbooks for you
 Essentials of Business Analytics (MindTap Course ...StatisticsISBN:9781305627734Author:Jeffrey D. Camm, James J. Cochran, Michael J. Fry, Jeffrey W. Ohlmann, David R. AndersonPublisher:Cengage Learning
Essentials of Business Analytics (MindTap Course ...
Statistics
ISBN:9781305627734
Author:Jeffrey D. Camm, James J. Cochran, Michael J. Fry, Jeffrey W. Ohlmann, David R. Anderson
Publisher:Cengage Learning