
APPLICATIONS+INVESTIGATIONS IN EARTH
18th Edition
ISBN: 9781533902405
Author: Tarbuck
Publisher: Hayden-McNeil Publishing
expand_more
expand_more
format_list_bulleted
Textbook Question
Chapter 3.7C, Problem 1A
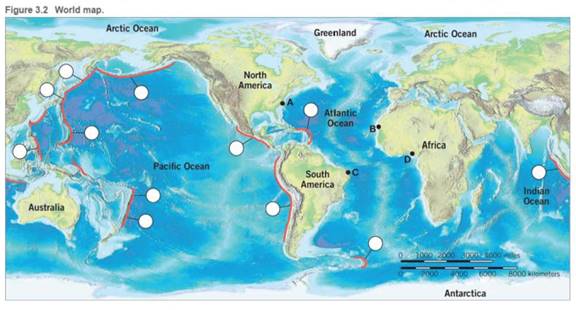
Using Figure 3.2, measure the distance from Point A located off the Carolina coast to Point B off the African coast. Determine the distance in kilometers and then convert that distance into centimeters.
Distance: ______km
Distance: ______cm
Expert Solution & Answer

Learn your wayIncludes step-by-step video

schedule03:02
Students have asked these similar questions
GIVEN THE FOLLOWING DATA, COMPUTE FOR THE FOLLOWING:
1. STRAIGHT LINE METHOD
2. ARITHMETIC GEOMETRIC CURVE
3. STATISTICAL PARABOLIC CURVE
WRITE A RECOMMENDATION REGARDING THE RESULTS AND WHICH OF THE
NETHOD IS BEST FIT FOR THE DATA.
Nate: answer on a separate document. Use excel in compute.
2.
Supposed this is Yc
(straightline)
450,000
370,000
750,000
1,100,000
1,500,000
1,000,000
1,700,000
2,000,000
1,900,000
2,300,000
Yi + 1
(Geometric)
YEAR
SALES
415,000 1
356,000
703,556
1,023,400
1,308,905
900,573
1,504,789
1,705,932
1,895,890
2,094,256
450,000
370,000
750,000
1,100,000
1,500,000
1,000,000
1,700,000
2,000,000
1,900,000
2,300,000
2011
2012
2013
3
2014
4.
2015
2016
6.
2017
2018
8
2019
2020
10
Dr. Thomas graduated from West Virginia University with a code value = 1 whlle Professor Harrison graduated
from the Marshall Unlversity with a code value = 2. The scale of measurement likely represented by this
Information Is:
O A. ratio.
O B. nominal.
O C. ordinal.
O D. interval.
12
f10
F8
F6
[2
$ Time Period (t).
3.
Time Series Value
F16
F14
12
f10
F8
F4
F2
Time Period (t).
Select your answer
What type of pattern exists in the data?
- Select your answer -
b. Develop the linear trend equation for this time series (to 1 decimal).
T =
+
c. What is the forecast for t = 6 (to 1 decimal)?
Chapter 3 Solutions
APPLICATIONS+INVESTIGATIONS IN EARTH
Ch. 3.1 - Using an atlas or Figure 3.11 for reference, draw...Ch. 3.1 - Use an atlas or your textbook to label the...Ch. 3.2 - Does Figure 3.3A represent a convergent or...Ch. 3.2 - Does Figure 3.38 represent a convergent,...Ch. 3.2 - Does Figure 3.3e represent a convergent,...Ch. 3.3A - Examine the east coast of South America and the...Ch. 3.3A - Examine the east coast of South America and the...Ch. 3.3A - On separate pieces of tracing paper, sketch the...Ch. 3.3B - Using the same two pieces of tracing paper you...Ch. 3.3B - Reassemble the two continents as you did in...
Ch. 3.5 - Figure 3.8 illustrates an idealized distribution...Ch. 3.5 - Figure 3.8 illustrates an idealized distribution...Ch. 3.5 - On Figure 3.8, outline the zone of earthquakes.Ch. 3.5 - Draw a line on Figure 3.8 at a depth of 100...Ch. 3.5 - The elastic rebound theory predicts that...Ch. 3.6 - How many intervals3, 5, or 7of reverse polarity...Ch. 3.6 - Approximately how many years ago did the current...Ch. 3.6 - Did Earth experience normal or reverse polarity...Ch. 3.6 - Did the period of normal polarity, C, bigin 1, 2,...Ch. 3.6 - During the past 4 million years, has each interval...Ch. 3.6 - Based on the pattern of magnetic reversals shown...Ch. 3.7A - On Figure 3.10, identify and mark the periods of...Ch. 3.7A - Using the South Atlantic as an example, label the...Ch. 3.7A - Using the distance scale at the bottom of Figure...Ch. 3.7A - The distances you obtained in Question 3 are for...Ch. 3.7B - North Atlantic: distance =km100,000cm/km=cm Rate...Ch. 3.7B - Pacific: distance =km100,000cm/km=cm Rate of...Ch. 3.7C - Using Figure 3.2, measure the distance from Point...Ch. 3.7C - Divide the distance in centimeters separating the...Ch. 3.7C - Repeat the procedure above to determine the age of...Ch. 3.7C - Based on your answers to Questions 2 and 3, which...Ch. 3.8 - What are the minimum and maximum ages of the...Ch. 3.8 - What is the approximate distance in kilometers...Ch. 3.8 - Using the data in Questions 1 and 2, calculate the...Ch. 3 - The distribution of earthquakes defines the...Ch. 3 - Prob. 2LRCh. 3 - Prob. 3LRCh. 3 - Prob. 4LRCh. 3 - Prob. 5LRCh. 3 - Prob. 6LRCh. 3 - Prob. 7LRCh. 3 - Prob. 8LRCh. 3 - Complete the block: diagrams in Figure 3.12 to...Ch. 3 - Prob. 10LRCh. 3 - List and explain two lines of evidence from this...
Additional Business Textbook Solutions
Find more solutions based on key concepts
What was the total ground subsidence, and what was the total drop in the level of water in the well during the ...
Applications and Investigations in Earth Science (8th Edition)
How much does pressure drop when you move from 8 km to 10 km at Key West?
_________ mb
Exercises for Weather & Climate (9th Edition)
SYNTHESIZE YOUR KNOWLEDGE This animal is a vertebrate with hair. What can you infer about its phylogeny? Identi...
Campbell Biology (11th Edition)
The particles emitted in the decay of 3H (tritium) interact with matter to create light in a glow- in-the-dark ...
University Physics Volume 3
Q8.9 In a completely inelastic collision between two objects, where the objects stick together after the collis...
University Physics with Modern Physics (14th Edition)
Level 2: Application/Analysis 4. Nitrifying bactcria participatc in the nitrogen cycle mainly by (A) converting...
Campbell Biology (10th Edition)
Knowledge Booster

Similar questions
- for the above question can you answer part b of it too:b. Calculate Forterra's cumulative translation gain/loss for 20X3 using the functional currency method. can you provide step by step solution explaining how each number is calculated. Thanksarrow_forwardWhich technique is the most accurate to measure the distance? O Pacing O Taping Measurement Wheel EDM Question 12 6 pts A road centerline gradient falls from sta 10+00, elevation-300 ft, to station 15+00 at a range of 1%. What is the elevation (ft) at station 15+00? O 295 285 300 O 290 O O O Oarrow_forward2. Consider three charges in the figure below. Assume that distances between charges d1-d3=4.24 m, d2-6 m and ẞ1=ẞ2 and ẞ3-90°. Here d₁ is the distance between Q1 and Q3, d2 is distance between Q1 and Q2, and d3 is a distance between Q2 and Q3. The charges are Q1=7 C, Q2-6 C and Q3=7 C. Calculate the magnitude of electric field E at the points a) P₁ (x = 0, y = 2.12), b) P2 (x 2.12, y = 2.12). Q₁ d₂ d₁ B₁ P₁ P2 B3 B₂ Q2 X Q₂ d3arrow_forward
- The figure above is an example of __________. A. line chart B. candlestick chart C. moving average line D. Bollinger bandarrow_forwardA wire with length 4.0 cm stretches along the x axis and carries a 3.0 A current to the right (+) The wire is in a uniform magnetic field B-(0.25i-0.30j+0.22k) T Determine the x-component of the force on the wire Express your answers using two significant figures. ΕΧΕΙ ΑΣΦ Fx 2.6 102 Submit Previous Answers Request Answer Part B Incorrect; Try Again; One attempt remaining Determine the y-component of the force on the wire. Express your answers using two significant figures. ΕΧΕΙ ΑΣΦ Fy Submit Previous Answers Request Answer ? ? N Narrow_forwardRound your answers to two decimal places. a. Determine the current ratio. b. Determine the quick ratio.arrow_forward
- Calculate: where x=1.0315, and n=31arrow_forwardQestion 2. Still needs to be solved. or Subpart #2. 2. Compute equivalent units using the weighted average method. Attached is 2 screenshots of the entire questionarrow_forward2.3 Internal Rate of Return of Project B (expressed to two decimal places) using interpolation.arrow_forward
- how do you do the math the get the percentage/decimal numbersarrow_forward1. The force of interest is given by 5 = 0.087. Compute the following values. In each case enter a percentage. i=|数字 % Enter an answer correct to 2 decimal places. ¿(12) = | 数字 % Enter an answer correct to 4 decimal places. d= 数字 % Enter an answer correct to 2 decimal places. 2. Given that d = 1.7%. Calculate the force of interest δ 8= 数字 Enter a value correct to 6 decimal placesarrow_forward16. Compute the arithmetic mean of the following numbers. (Round your answer to two decimal places.) 84, 44, 56, 73, 42, 16, 26, 51 a.39.00 b.40.50 c.49.00 d.51.87arrow_forward
arrow_back_ios
SEE MORE QUESTIONS
arrow_forward_ios
Recommended textbooks for you
 Essentials of Business Analytics (MindTap Course ...StatisticsISBN:9781305627734Author:Jeffrey D. Camm, James J. Cochran, Michael J. Fry, Jeffrey W. Ohlmann, David R. AndersonPublisher:Cengage Learning
Essentials of Business Analytics (MindTap Course ...
Statistics
ISBN:9781305627734
Author:Jeffrey D. Camm, James J. Cochran, Michael J. Fry, Jeffrey W. Ohlmann, David R. Anderson
Publisher:Cengage Learning