Concept explainers
Videos
To analyze:
The mechanisms and the processes that occurs in the squirrels for raising their body temperatures.
Given:
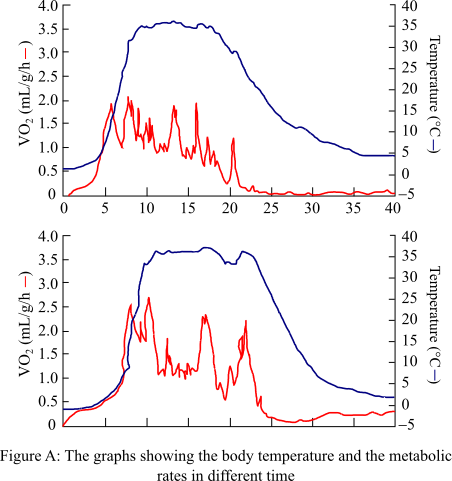
The arctic ground squirrels were kept in the hibernating chambers by the researchers. These squirrels can build the burrows that can reach –10°C. The hibernating chambers in the laboratory were held at either +2°C or –12°C. It was observed that all the squirrels taken into consideration entered bouts of torpor repeatedly. The body temperatures (Tb) and the
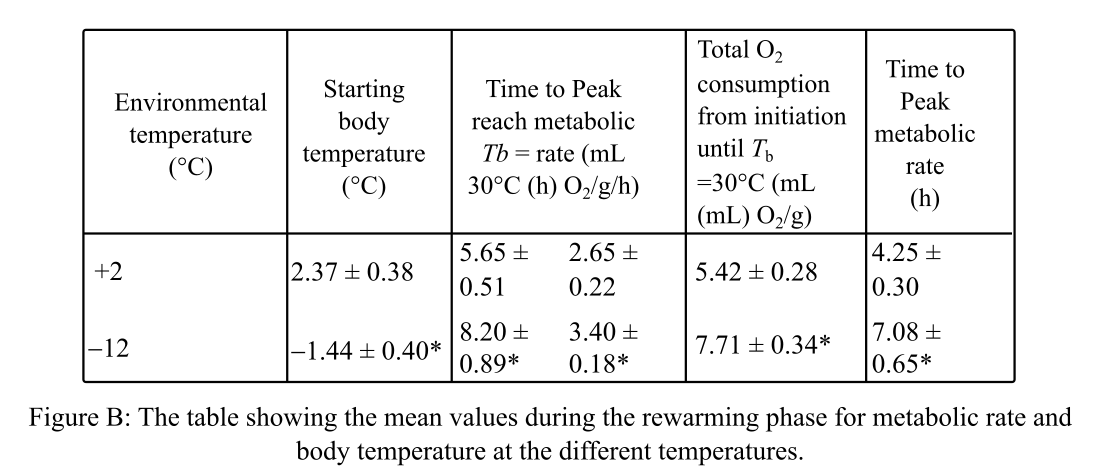
The given table depicts the mean values of the metabolic rate and the temperature during the rewarming phase with their standard errors. The observation taken is for the two groups of squirrels at the different temperatures.
Introduction:
There are two types of animals: ectotherms and endotherms. Ectotherms have a constant body temperature, while the endotherms have to change their internal body temperature according to the temperature outside the body.
Want to see the full answer?
Check out a sample textbook solution
Chapter 39 Solutions
EBK LIFE: THE SCIENCE OF BIOLOGY


- A desert beetle in northern Mexico can change its behavior to regulate its body temperature above 35c. When would being in a burrow not be the best option for cooling off?arrow_forwardAllen's rule refers to: the relationship between body size and temperature the relationship between appendage size and temperature the relationship between torso size and altitude the relationship between skin tone and latitudearrow_forwardUse Verbal description of results from graph and then Interpret the graph for Pre camouflage sccenario in foraging lab. The interpretations must include Were the results expected and Did they support the hypotheses? If so, state the biological significance of the results from graph. If the results deviated significantly from expected results, discuss the hypotheses onthe basis of expected results and include an explanation of why this might be so. Lastly, state the conclusions drawn from the experiment and their biological relevance. Hypothesis: In the scenario involving prey camouflage, the hypothesis is that species taking extended periods to forage, especially novice foragers, would be at heightened risk of predation due to their prolonged exposure.arrow_forward
- Use Verbal description of results from graph and then Interpret the graph for Pre camouflage sccenario in foraging lab. The interpretations must include Were the results expected and Did they support the hypotheses? If so, state the biological significance of the results from graph. If the results deviated significantly from expected results, discuss the hypotheses onthe basis of expected results and include an explanation of why this might be so. Lastly, state the conclusions drawn from the experiment and their biological relevance. Hypothesis: n the scenario involving prey camouflage, the hypothesis is that prey species will exhibit seasonal variations in their choice of beans for consumption based on the available background vegetation, with a preference for pinto beans during the first half of winter when they are more visually similar to their surroundings and a preference for pea beans during the second half of winter when they better match the changing background vegetation.arrow_forwardWhy is it essential for organisms to maintain a relatively constant body temperature? Describe adaptations that help the organisms cope with changes in environmental temperature.arrow_forwardA group of researchers are interested in whether temperature has an affect on time to metamorphosis in a species of frog. Eggs from a single pond were obtained and raised at either 15°C or 25°C until metamorphosis completed. Time (days) 15°C 25°C 360 379 375 353 354 299 378 349 385 323 359 298 371 301 355 375 μ 367.1 334.6 S 11.66 33.85 Time to metamorphosis at 25°C quantile Time to metamorphosis at 15°C quantile 385 380 375 370 365 360 355 +3 -1.5 380 360 340 320 300 -1.0 -0.5 00 05 10 1.5 Normal quantile -1.5 -1.0 -0.5 00 0.5 1.0 Normal quantile a) List the potential statistical tests that could be used to test the researcher's hypothesis, how they compare in terms of power, and the assumptions made by those tests. (3 marks) b) Based on the data, which test should be used? Provide a brief explanation and test any assumptions, as necessary to come to your conclusion. (4 marks) c) Conduct a statistical analysis using that test. (8 marks)arrow_forward
- Eastern tent caterpillars (Malacosoma americanum) live in large groups in silk nests, or tents, which they build in trees. They are among the first insects to be active in early spring, when daily temperature fluctuates from freezing to very hot. Over the course ofa day, they display striking differences in behavior: Early in the morning, they rest in a tightly packed group on the tent's east-facing surface. In midafternoon, they are on its undersurface, each caterpillar hanging by a few of its legs. Propose a hypothesis to explain this behavior. How could you test it? ATLEAST 50 SENTENCEarrow_forwardEastern tent caterpillars (Malacosoma americanum) live in large groups in silk nests resembling tents, which they build in trees. They are among the first insects to be active in early spring, when daily temperature fluctuates from freezing to very hot. Over the course of a day, they display striking differences in behavior: Early in the morning, they rest in a tightly packed group on the tent’s east-facing surface. In midafternoon, they are on its undersurface, each caterpillar hanging by a few of its legs. Propose a hypothesis to explain this behavior. How could you test it?arrow_forwardUse Verbal description of results from graph and then Interpret the graph for Novice vs. Exprienced sccenario in foraging lab. The interpretations must include Were the results expected and Did they support the hypotheses? If so, state the biological significance of the results from graph. If the results deviated significantly from expected results, discuss the hypotheses onthe basis of expected results and include an explanation of why this might be so. Lastly, state the conclusions drawn from the experiment and their biological relevance. Hypothesis: In Foraging is that animals with prior foraging experience would demonstrate higher survival rates than novice foragers, emphasizing the role of experience in honing foraging skills.arrow_forward
- an animal’s body size is one of itsmost important properties. Considering all the mammals thatlive in deserts, explain why their body sizes matter. Includediscussion of physiological mechanisms where appropriate.arrow_forwardHow do animals that live in extreme winter environments survive below-freezingt temperatures.arrow_forwardUse Verbal description of results from graph and then Interpret the graph for Effect of Food Density sccenario in foraging lab. The interpretations must include Were the results expected and Did they support the hypotheses? If so, state the biological significance of the results from graph. If the results deviated significantly from expected results, discuss the hypotheses onthe basis of expected results and include an explanation of why this might be so. Lastly, state the conclusions drawn from the experiment and their biological relevance. Hypothesis: higher food density corresponds to an extended duration of foraging.arrow_forward
 Case Studies In Health Information ManagementBiologyISBN:9781337676908Author:SCHNERINGPublisher:CengageHealth Safety And Nutrition F/Young ChildHealth & NutritionISBN:9781305144767Author:MAROTZPublisher:Cengage