Subpart (a):
To illustrate the given situation with
Subpart (a):
Explanation of Solution
Figure 1 illustrates the
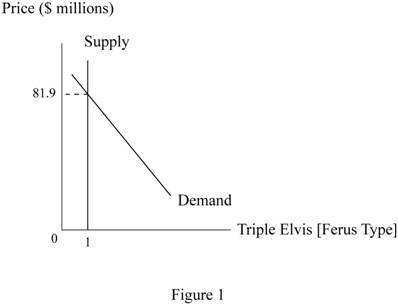
The figure 1 shows the demand and supply curves for the artwork Triple Elvis, which was sold in auction for $81.9 million. The horizontal axis measures the quantity and the vertical axis measures the price of the commodity. The supply curve is a vertical line because the quantity of the artwork is fixed and unity.
Concept Introduction:
Demand Curve: A demand curve is a graph which shows the quantities of a commodity that the consumers will buy at different price levels.
Supply Curve: A supply curve is a graph which shows the quantities of a commodity that the producers are willing to sell at different price levels.
Subpart (b):
To illustrate the given situation with supply and demand curves.
Subpart (b):
Explanation of Solution
Figure 2 illustrates the change in market equilibrium.
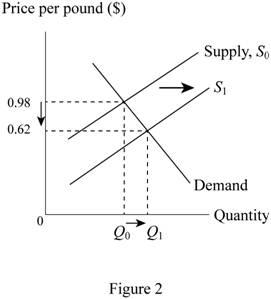
The figure2 shows the demand and supply curves for the hogs. The horizontal axis measures the quantity and the vertical axis measures the price of the commodity. The increase in the supply of the hogs has led to a rightward shift of the supply curve and while the demand remains unchanged. As a result the equilibrium changes and the prices decrease from 98 cents to 62 cents and the quantity increases from Q0 to Q1.
Concept Introduction:
Demand Curve: A demand curve is a graph which shows the quantities of a commodity that the consumers will buy at different price levels.
Supply Curve: A supply curve is a graph which shows the quantities of a commodity that the producers are willing to sell at different price levels.
Subpart (c):
To illustrate the given situation with supply and demand curves.
Subpart (c):
Explanation of Solution
Figure 3 illustrates the change in market equilibrium.
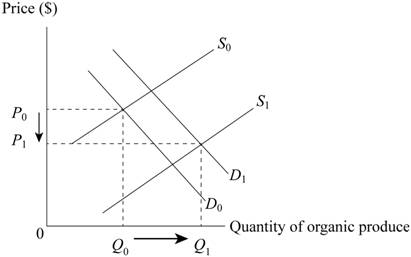
The figure3 shows the demand and supply curves for the organic produce. The horizontal axis measures the quantity and the vertical axis measures the price of the commodity. The initial increase in the demand for organic produce led to the shift of the demand curve from D0 to D1. However, the increase in the number of farmers producing the organic produce also increased leading to an increase in the supply of the product which shifts the supply curve from S0 to S1. The combined effect is that the price of organic produce reduces from P0 to P1 as the quantity supplied increases from Q0 to Q1.
Concept Introduction:
Demand Curve: A demand curve is a graph which shows the quantities of a commodity that the consumers will buy at different price levels.
Supply Curve: A supply curve is a graph which shows the quantities of a commodity that the producers are willing to sell at different price levels.
Want to see more full solutions like this?
Chapter 4 Solutions
EBK PRINCIPLES OF MACROECONOMICS

- Use the four-step process to analyze the impact of a Deduction in tariffs on imports of iPods on the equilibrium price and quantity of Sony Walkman-type products.arrow_forwardThe following table summarizes information about the market for principles of economics textbooks: Price Quantity Demanded per Year Quantity Supplied per Year $45 4,300 300 55 2,300 700 65 1,300 1,300 75 800 2,100 85 650 3,100 What is the market equilibrium price and quantity of textbooks? To quell outrage over tuition increases, the college places a $55 limit on the price of textbooks. How many textbooks will be sold now? While the price limit is still in effect, automated publishing increases the efficiency of textbook production. Show graphically the likely effect of this innovation on the market price and quantity.arrow_forward59arrow_forward
- The following graph shows the annual market for Florida oranges, which are sold in units of 90-pound boxes. (graph in photo) In this market, the equilibrium price is ____ per box, and the equilibrium quantity of oranges is ____ million boxes. For each of the prices listed in the following table, determine the quantity of oranges demanded, the quantity of oranges supplied, and the direction of pressure exerted on prices in the absence of any price controls. Price Quantity Demanded Quantity Supplied Pressure on Prices (Dollars per box) (Millions of boxes) (Millions of boxes) 35 15 True or False: A price ceiling above $25 per box is a binding price ceiling in this market. a. True b. False Because it takes many years before newly planted orange trees bear fruit, the supply curve in the short run is almost vertical. In the long run, farmers can decide whether to plant oranges on their land, to plant something…arrow_forwardThe following graph shows the monthly demand and supply curves in the market for hats. (graph in image) The equilibrium price in this market is $______ per hat, and the equilibrium quantity is ___ hats bought and sold per month. Complete the following table by indicating at each price whether there is a shortage or surplus in the market, the amount of that shortage or surplus, and whether this places upward or downward pressure on prices. Price Shortage or Surplus Shortage or Surplus Amount Pressure 60 40arrow_forwardSuppose that Carlos and Deborah are the only suppliers of pieces of cake in some hypothetical market. Their annual supply schedules are given by the following table: Carlos's Quantity Supplied Deborah's Quantity Supplied (Pieces) ITT 20 30 35 40 PRICE (Dollars per piece) (Dollars per piece) 5 Price 0 0 1 2 3 4 5 20 On the following graph, plot Carlos's supply of pieces of cake using the green points (triangle symbol). Next, plot Deborah's supply of pieces of cake using the purple points (diamond symbol). Finally, plot the market supply of pieces of cake using the orange points (square symbol). Note: Line segments will automatically connect the points. Remember to plot from left to right. (?) 40 60 80 QUANTITY (Pieces) 100 (Pieces) 120 20 40 55 65 70 Carlos's Supply Deborah's Supply O Market Supplyarrow_forward
- The diagram describes the hypothetical demand and supply for canned tuna in Canada in 2022. a. Suppose the price of a can of tuna is $4.00. What is the quantity demanded? What is the quantity supplied? At this price, is there a shortage or a surplus? By what amount? If the price is $4.00, the quantity demanded is supplied is million cans. There is a (Round your responses to the nearest integer) million cans and the quantity by million cans. b. Suppose the price of a can of tuna is $2.50. What is the quantity demanded? What is the quantity supplied? At this price, is there a shortage or a surplus? By what amount? If the price is $2.50, the quantity demanded is supplied is million cans. There is a (Round your responses to the nearest integer) c. What is the equilibrium price and quantity in this market? million cans and the quantity by million cans. The equilibrium price is S per can, and the equilibrium quantity is milion Caris (Round your responses to the nearest integer) Price…arrow_forwardThe following graph shows the monthly demand and supply curves in the market for shirts. The equilibrium price in this market is $_________ per shirt, and the equilibrium quantity is ______ shirts bought and sold per month. Complete the following table by indicating at each price whether there is a shortage or surplus in the market, the amount of that shortage or surplus, and whether this places upward or downward pressure on prices. Pressure on price options for table: downward, upwardarrow_forward........arrow_forward
- The following graph shows the market for cars in 2008. Between 2008 and 2009, the equilibrium quantity of cars remained constant, but the equilibrium price of cars decreased. From this, you can conclude that between 2008 and 2009, the supply of cars _____ (decreased, increased, was unchanged) and the demand for cars _____ (decreased, increased, was unchanged). Adjust the graph to illustrate your answer by showing the positions of the supply and demand curves in 2009.arrow_forwardThe figure above shows a market that is originally at equilibrium at Point A, the intersection between been supply curve S1 and demand curve D1. Which of the following events would result in the market reaching a new equilibrium at Point C? Question 10Answer a. An increase in supply and a decrease in the quantity demanded. b. A decrease in supply and an increase in the quantity demanded. c. A decrease in the quantity supplied and a decrease in demand. d. A decrease in supply and a decrease in the quantity demanded.arrow_forwardList six basic determinants of market supply that could cause supply to increase. Be specific with those determinants (or causes, factors, or shifters of demand curve) how they will increase market supply.arrow_forward
 Exploring EconomicsEconomicsISBN:9781544336329Author:Robert L. SextonPublisher:SAGE Publications, Inc
 Microeconomics: Principles & PolicyEconomicsISBN:9781337794992Author:William J. Baumol, Alan S. Blinder, John L. SolowPublisher:Cengage Learning
 Economics (MindTap Course List)EconomicsISBN:9781337617383Author:Roger A. ArnoldPublisher:Cengage Learning
