
Concept explainers
Videos
A.
To draw: Graph of the substrate concentration in the X axis versus the
Concept introduction: Enzymes are biological protein catalysts that alter the speed of the reaction in the biological system. The
A.
Explanation of Solution
Pictorial representation:
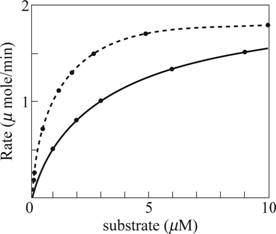
Fig. 1: A graph of the substrate concentration verses the rate of the reaction
Explanation:
| [S] µM | Rate µ mole/min |
| 0.08 | 0.15 |
| 0.12 | 0.21 |
| 0.54 | 0.70 |
| 1.23 | 1.1 |
| 1.82 | 1.3 |
| 2.72 | 1.5 |
| 4.94 | 1.7 |
| 10.00 | 1.8 |
With the above data, the graph is plotted. The black curve in Fig. 1 is the obtained graph from which the KMis evident as 1µM and the Vmax evident as 2 µmole/min.
B.
To explain: The results agree with the estimates made from the first graph of the raw data.
Concept introduction: Enzymes are biological protein catalysts that alter the speed of the reaction in the biological system. The chemical reactions that are catalyzed by these enzymes are studied under enzyme kinetics. The reaction rate is measure based on the rate at which the substrate of the enzymes combines with the enzyme and forms the products. KM is the Michaelis–Menton constant. KM value is not a direct measure of the affinity of the enzyme toward the substrate, but concentration of S where velocity at maximum is half. Vmax is the maximum velocity with which the enzyme catalyzes the reaction.
B.
Explanation of Solution
Pictorial representation:
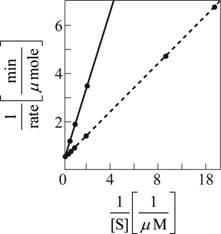
Fig. 2: A reciprocal graph of the substrate concentration verses the rate of the reaction
Explanation:
| 1/[S] (1/ µM) | 1/Rate min/ µ mole |
| 12.50 | 6.7 |
| 8.30 | 4.8 |
| 1.85 | 1.4 |
| 0.81 | 0.91 |
| 0.56 | 0.77 |
| 0.37 | 0.67 |
| 0.20 | 0.59 |
| 0.10 | 0.56 |
With the above data, the graph is plotted. The straight black line in Fig. 2 is the obtained graph from which the KMis evident as 1µM and the Vmax evident as 2 µmole/min. The data are easier to interpret in the second graph as the plot gives a straight line.
C.
To explain: The reason why the statement that very little product was formed in the given reaction condition is important.
Concept introduction: Enzymes are biological protein catalysts that alter the speed of the reaction in the biological system. The chemical reactions that are catalyzed by these enzymes are studied under enzyme kinetics. The reaction rate is measure based on the rate at which the substrate of the enzymes combines with the enzyme and forms the products. KM is the Michaelis–Menton constant. KM value is not a direct measure of the affinity of the enzyme toward the substrate, but concentration of S where velocity at maximum is half. Vmax is the maximum velocity with which the enzyme catalyzes the reaction.
C.
Explanation of Solution
D.
To explain: Plot of the graph for substrate concentration versus rate of the reaction and reciprocal of the substrate concentration versus the rate of the reaction when the enzyme upon regulated with phosphorylation, the KM value increases by a factor of 3 without any change in the Vmax.
Concept introduction: Enzymes are biological protein catalysts that alter the speed of the reaction in the biological system. The chemical reactions that are catalyzed by these enzymes are studied under enzyme kinetics. The reaction rate is measure based on the rate at which the substrate of the enzymes combines with the enzyme and forms the products. KM is the Michaelis–Menton constant. KM value is not a direct measure of the affinity of the enzyme toward the substrate, but concentration of S where velocity at maximum is half. Vmax is the maximum velocity with which the enzyme catalyzes the reaction.
D.
Explanation of Solution
KM value is directly proportional to the substrate concentration. Therefore, as the KM increases, the substrate concentration to give half of the maximum rate increases.
Since more concentration of the substrate is needed to produce the same rate of the reaction; the regulation with phosphorylation inhibits the enzyme-catalyzing reaction. The expected data plots for the same is plotted as dotted curve in Fig 1 for substrate concentration versus rate of the reaction and dotted line in Fig 2 for reciprocal plot of substrate concentration versus rate of the reaction.
| [S] µM | Rate µ mole/min |
| 0.24 | 0.15 |
| 0.36 | 0.21 |
| 1.62 | 0.70 |
| 3.69 | 1.1 |
| 5.46 | 1.3 |
| 8.16 | 1.5 |
| 14.82 | 1.7 |
| 30.00 | 1.8 |
| 1/[S] (1/ µM) | 1/Rate min/ µ mole |
| 4.16 | 6.7 |
| 2.78 | 4.8 |
| 0.61 | 1.4 |
| 0.27 | 0.91 |
| 0.18 | 0.77 |
| 0.12 | 0.67 |
| 0.06 | 0.59 |
| 0.03 | 0.56 |
With the above data, 3[S] is taken for X axis and the rate of the reaction remains the same. The expected data plots for the same is plotted as dotted curve in Fig. 1 for substrate concentration versus rate of the reaction and dotted line in Fig. 2 for reciprocal plot of substrate concentration versus rate of the reaction.
Want to see more full solutions like this?
Chapter 4 Solutions
Essential Cell Biology (fifth Edition)


 Human Anatomy & Physiology (11th Edition)BiologyISBN:9780134580999Author:Elaine N. Marieb, Katja N. HoehnPublisher:PEARSON
 Biology 2eBiologyISBN:9781947172517Author:Matthew Douglas, Jung Choi, Mary Ann ClarkPublisher:OpenStax
 Anatomy & PhysiologyBiologyISBN:9781259398629Author:McKinley, Michael P., O'loughlin, Valerie Dean, Bidle, Theresa StouterPublisher:Mcgraw Hill Education,
 Molecular Biology of the Cell (Sixth Edition)BiologyISBN:9780815344322Author:Bruce Alberts, Alexander D. Johnson, Julian Lewis, David Morgan, Martin Raff, Keith Roberts, Peter WalterPublisher:W. W. Norton & Company
 Laboratory Manual For Human Anatomy & PhysiologyBiologyISBN:9781260159363Author:Martin, Terry R., Prentice-craver, CynthiaPublisher:McGraw-Hill Publishing Co.
 Inquiry Into Life (16th Edition)BiologyISBN:9781260231700Author:Sylvia S. Mader, Michael WindelspechtPublisher:McGraw Hill Education