
Materials For Civil And Construction Engineers In Si Units
4th Edition
ISBN: 9781292154404
Author: Michael S Mamlouk
Publisher: PEARSON
expand_more
expand_more
format_list_bulleted
Concept explainers
Videos
Textbook Question
Chapter 4, Problem 4.16QP
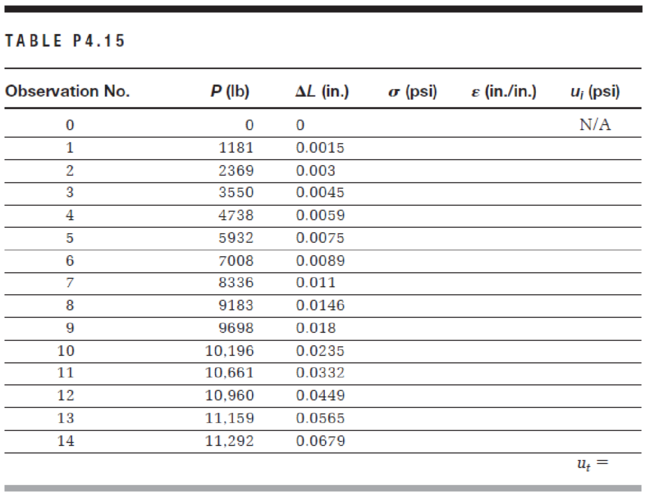
In Problem 4.15, plot the stress–strain relationship and determine the following:
- a. the elastic modulus
- b. the proportional limit
- c. the yield strength at a strain offset of 0.002
- d. the tensile strength
- e. the magnitude of the load required to produce an increase in length of 0.016 in.
- f. the final deformation, if the specimen is unloaded after being strained by the amount specified in (e)
- g. in designing a typical structure made of this material, would you expect the stress applied in (e) to be reasonable? Why?
Expert Solution & Answer
Want to see the full answer?
Check out a sample textbook solution
Students have asked these similar questions
A tension test performed on a metal specimen to fracture produced the stress-strain relationship shown in Figure. Graphically determine the following (show units and all work):a. Modulus of elasticity within the linear portion.b. Yield stress at an offset strain of 0.002 in./in.c. Yield stress at an extension strain of 0.005 in/in.d. Secant modulus at a stress of 62 ksi.e. Tangent modulus at a stress of 65 ksi.
The data shown in the table were obtained from a tensile test of a metal specimen with a rectangular cross-section of 0.2 in.? in area and a gage length (the length over which the elongation is measured) of 2.000 inches.
a. Generate a table of stress and strain values.
b. Plot these values and draw a best-fit line to obtain a stress-strain curve.
c. Determine the modulus of elasticity from the slope of the linear portion of the curve.
d. Estimate the value of the proportional limit.
e. Use the 0.2% offset method to determine the yield stress.
The strain rosette shown in the figure was used to obtain the following normal strain data on a piece of aluminum. The plate has a modulus of elasticity of 10,000 ksi and a Poisson’s Ratio of 0.35. The strain readings were εa = 600 με, εb = 900 με, and εc = 120 με. Note: 1 με = 1 X 10⁻⁶ in/in. a) Calculate the normal strain in the x- and y- directions (εx and εy) and the shear strain (γxy) using a system of equations. b) Calculate the normal stress σx in ksi. Clearly indicate Tension (T) or Compression (C). Note: even though the normal stress in the z-direction is zero, but the normal strain in the z-direction is NOT zero. [Ans. to Check σx = 7.18 ksi (T)] c) Calculate the normal stress σy in ksi. Clearly indicate Tension (T) or Compression (C). d) Calculate the shear stress τxy in ksi.
Chapter 4 Solutions
Materials For Civil And Construction Engineers In Si Units
Ch. 4 - Name the two primary factors that make aluminum an...Ch. 4 - Prob. 4.2QPCh. 4 - An aluminum alloy specimen with a radius of 0.28...Ch. 4 - An aluminum alloy bar with a radius of 7 mm was...Ch. 4 - Decode the characteristics of a 6063 T831...Ch. 4 - A round aluminum alloy bar with a 0.6 in. diameter...Ch. 4 - An aluminum alloy bar with a rectangular cross...Ch. 4 - A round aluminum alloy bar with a 0.25-in....Ch. 4 - An aluminum alloy rod has a circular cross section...Ch. 4 - An aluminum alloy cylinder with a diameter of 3...
Ch. 4 - A 3003-H14 aluminum alloy rod with 0.5 in....Ch. 4 - The stressstrain relation of an aluminum alloy bar...Ch. 4 - An aluminum specimen originally 300 mm long is...Ch. 4 - A tension stress of 40 ksi was applied on a 12-in....Ch. 4 - A tension test was performed on an aluminum alloy...Ch. 4 - In Problem 4.15, plot the stressstrain...Ch. 4 - Referring to Figure 4.5, determine approximate...Ch. 4 - Prob. 4.18QPCh. 4 - A tensile stress is applied along the long axis of...Ch. 4 - A cylindrical aluminum alloy rod with a 0.5 in....Ch. 4 - Prob. 4.21QPCh. 4 - Discuss galvanic corrosion of aluminum. How can...
Knowledge Booster


Learn more about
Need a deep-dive on the concept behind this application? Look no further. Learn more about this topic, civil-engineering and related others by exploring similar questions and additional content below.Similar questions
- The data in Table 1.5.3 were obtained from a tensile test of a metal specimen with a rectangular cross section of 0.2011in.2 in area and a gage length (the length over which the elongation is measured) of 2.000 inches. The specimen was not loaded to failure. a. Generate a table of stress and strain values. b. Plot these values and draw a best-fit line to obtain a stress-strain curve. c. Determine the modulus of elasticity from the slope of the linear portion of the curve. d. Estimate the value of the proportional limit. e. Use the 0.2 offset method to determine the yield stress.arrow_forwardThe results of a tensile test are shown in Table 1.5.2. The test was performed on a metal specimen with a circular cross section. The diameter was 3 8 inch and the gage length (The length over which the elongation is measured) was 2 inches. a. Use the data in Table 1.5.2 to produce a table of stress and strain values. b. Plot the stress-strain data and draw a best-fit curve. c. Compute the, modulus of elasticity from the initial slope of the curve. d. Estimate the yield stress.arrow_forwardCompare the engineering and true secant elastic moduli for the natural rubber in Example Problem 6.2 at an engineering strain of 6.0. Assume that the deformation is all elastic.arrow_forward
- A tensile test was performed on a metal specimen having a circular cross section with a diameter of 1 2 inch. The gage length (the length over which the elongation is measured) is 2 inches. For a load 13.5 kips, the elongation was 4.6610 3 inches. If the load is assumed to be within the linear elastic rang: of the material, determine the modulus of elasticity.arrow_forwardA tensile test was performed on a metal specimen having a circular cross section with a diameter 0. 510 inch. For each increment of load applied, the strain was directly determined by means of a strain gage attached to the specimen. The results are, shown in Table: 1.5.1. a. Prepare a table of stress and strain. b. Plot these data to obtain a stress-strain curve. Do not connect the data points; draw a best-fit straight line through them. c. Determine the modulus of elasticity as the slope of the best-fit line.arrow_forwardA tensile test was performed on a metal specimen having a circular cross section with a diameter of 0.510 inch. For each increment of load applied, the strain was directly determined by means of a strain gage attached to the specimen. The results are shown in Table 1.1.a. Prepare a table of stress and strainb. Plot these data to obtain a stress-strain curve. Do not connect the data points; draw a best-fit straight line through them.c. Determine the modulus of elasticity as the slope of the best-fit lineLoad (Ib)Strain × 106 (in./in.)0025037.150070.31000129.11500230.12000259.42500372.43000457.73500586.5arrow_forward
- A cylindrical specimen of aluminum alloy having a diameter of 12.8 mm and a gauge length (lo) of 50.800 mm is pulled in tension. Use the load–elongation characteristics shown in the following table and answer the following questions. (10p) i- Convert the data as engineering stress (σ) versus engineering strain (ε). ii- Compute the modulus of elasticity (E) (with a precision of ±5000 MPa) iii- Determine the yield strength at a strain offset of 0.002 (σy) (with a precision of ±20 MPa) iv- Determine the tensile strength (TS) of this alloy.arrow_forwardConsider a cylindrical metal 6 mm in diameter and 50 mm long ispulled in tension. It is known that yield strength and elastic (Young’s) Modulus of thematerial are 200 MPa and 100 GPa, respectively, and its Poisson’s Ratio is 0.3.(a) Determine whether the deformation is elastic or plastic when 6000 N is applied.(b) Calculate specimen elongation (∆l) and reduction in diameter (∆d) when 5000 N isapplied? What are the values ∆l and ∆d when the load is released?(c) If necking occurs at a load of 8850 N, determine the UTS of the metal.(d) Calculate the ductility in terms of % E.L. if the length of the specimen at fracturepoint is 56.0 mm.arrow_forwardBased in the table 1.1) Develop a best-fit equation for the relationship between stress and strain. Employ Naïve–Gauss elimination method whenever necessary.S=______+______e + _______e2 2) Determine the coefficient of determination for the equation. R2 =_______ 3) Calculate the stress value to the most accurate value at strain value 0.53.s = _______Pa4) The yield point is the point on a stress–strain curve that indicates the limit of elastic behaviour and the beginning of plastic behavior. In this case, the yield point occurs at a stress value of 80. Determine the corresponding strain value at the yield point. In any relevant method, use a stopping criterion of 0.05% e =_______ 5) The ultimate strength is the maximum point on the stress–strain curve. This corresponds to the maximum stress that can be sustained by a structure in tension. Compute the ultimate strength point of the polymeric material (strain value that gives maximum stress). In any relevant method, use a stopping…arrow_forward
arrow_back_ios
arrow_forward_ios
Recommended textbooks for you
 Steel Design (Activate Learning with these NEW ti...Civil EngineeringISBN:9781337094740Author:Segui, William T.Publisher:Cengage Learning
 Materials Science And Engineering PropertiesCivil EngineeringISBN:9781111988609Author:Charles GilmorePublisher:Cengage Learning
Steel Design (Activate Learning with these NEW ti...
Civil Engineering
ISBN:9781337094740
Author:Segui, William T.
Publisher:Cengage Learning
Materials Science And Engineering Properties
Civil Engineering
ISBN:9781111988609
Author:Charles Gilmore
Publisher:Cengage Learning
Mechanical Properties of Material; Author: Civil Engineering;https://www.youtube.com/watch?v=UZkUvWiNeDs;License: Standard YouTube License, CC-BY