
Videos
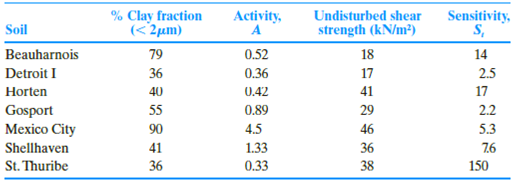
The properties of seven different clayey soils are shown below (Skempton and Northey, 1952). Investigate the relationship between the strength and plasticity characteristics by performing the following tasks:
a. Estimate the plasticity index for each soil using Skempton’s definition of activity [Eq. (4.28)].
b. Estimate the probable mineral composition of the clay soils based on PI and A (use Table 4.3)
c. Sensitivity (St) refers to the loss of strength when the soil is remolded or disturbed. It is defined as the ratio of the undisturbed strength (τf-undisturbed) to the remolded strength (τf-remolded)) at the same moisture content [Eq. (12.49)]. From the given data, estimate τf-remolded for the clay soils.
d. Plot the variations of undisturbed and remolded shear strengths with the activity, A, and explain the observed behavior.
(a)
Find the plasticity index for each soil using Skempton’s definition of activity.
Explanation of Solution
Determine the plasticity index of the Beauharnais soil using the relation.
Here, A is an activity.
Substitute 0.52 for A and 79 for % of clay–size fraction, by weight.
Similarly, calculate the plasticity index for the remaining soils.
Determine the remolded shear strength of the Beauharnais soil using the relation.
Here,
Substitute
Similarly, calculate the remolded shear strength of the remaining soils.
Summarize the calculated values of plasticity index and the remolded shear strength as in Table 1.
| Soil | % Clay fraction | Activity A | Plasticity Index |
| Beauharnois | 79 | 0.52 | 41.08 |
| Detroit I | 36 | 0.36 | 12.96 |
| Horten | 40 | 0.42 | 16.80 |
| Gosport | 55 | 0.89 | 48.95 |
| Mexico City | 90 | 4.5 | 405 |
| Shell haven | 41 | 1.33 | 54.53 |
| St.Thuribe | 36 | 0.33 | 11.88 |
(b)
Find the probable mineral composition of the clay soils based on PI and A.
Explanation of Solution
Determine the probable mineral composition of the clay soils based on PI and A.
Refer Table 4.3, “Typical values of liquid limit, plastic limit, and activity of some clay minerals” in the textbook.
Take the mineral composition of the Beauharnois soil as Illite for the activity value of 0.52 and the plasticity index value of 41.08.
Therefore, the mineral composition of Beauharnois soil is Illite.
Similarly, calculate the probable mineral composition of the remaining soils.
Summarize the calculated values of mineral composition as in Table (2).
| Soil | Activity A | Plasticity Index | Mineral composition |
| Beauharnois | 0.52 | 41.08 | Illite |
| Detroit I | 0.36 | 12.96 | Kaolinite |
| Horten | 0.42 | 16.80 | Kaolinite |
| Gosport | 0.89 | 48.95 | Illite |
| Mexico City | 4.5 | 405 | Montmorillonite |
| Shell haven | 1.33 | 54.53 | Montmorillonite |
| St.Thuribe | 0.33 | 11.88 | Kaolinite |
(c)
Find the remoulded shear strength of the clay soil.
Explanation of Solution
Determine the remoulded shear strength of the Beauharnais soil using the relation.
Here,
Substitute
Similarly, calculate the remolded shear strength of the remaining soils.
Summarize the calculated values of remolded shear strength as in Table 3.
| Soil | Activity A | Undisturbed Shear strength | Sensitivity |
Remoulded Shear strength |
| Beauharnois | 0.52 | 18 | 14 | 1.3 |
| Detroit I | 0.36 | 17 | 2.5 | 6.8 |
| Horten | 0.42 | 41 | 17 | 2.4 |
| Gosport | 0.89 | 29 | 2.2 | 13.2 |
| Mexico City | 4.5 | 46 | 5.3 | 8.7 |
| Shell haven | 1.33 | 36 | 7.6 | 4.7 |
| St.Thuribe | 0.33 | 38 | 150 | 0.3 |
(d)
Plot the variations of undisturbed and remolded shear strengths with the activity A.
Explanation of Solution
Refer Table 3.
Plot the graph between the undisturbed, remolded shear strengths with the activity A as in Figure 1.
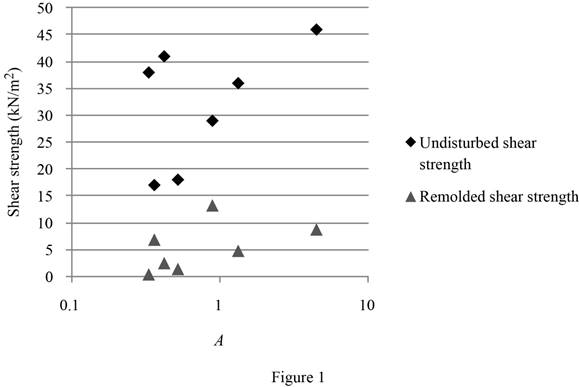
The shear strength of the clay obtains from two components, one is cohesion, which is the cementing force between particles, and second one is frictional resistance, which is mainly due to the particle movement of one particle over another. The cohesion contribution is greater to the shear strength, when the clay activity is greater. Although no reliable correlation can be developed from Figure 1, both the undisturbed and remolded shear strengths certainly show increasing trends as the activity increases.
Want to see more full solutions like this?
Chapter 4 Solutions
PRIN.OF GEOTECHNICAL...-MINDTAP(2 SEM)


- Refer to the soil in Problem 4.5. Using the Casagrande plasticity chart, graphically estimate the shrinkage limit of the soil as shown in Figure 4.22. 4.5 The following data were obtained by conducting liquid limit and plastic limit tests on a soil collected from the site. Liquid limit tests: Plastic limit test: PL = 19.3% a. Draw the flow curve and determine the liquid limit. b. Using the Casagrande plasticity chart (Figure 4.21), determine the soil type.arrow_forwardThe properties of seven different clayey soils are shown below. Investigate the relationship between the strength and plasticity characteristics by performing the following tasks: Soil Beauharnois Detroit I Horten Gosport Mexico City Shellhaven St. Thuribe Mineral % Clay fraction (<2 μm) Kaolinite Illite 79 36 40 55 90 41 36 Montmorillonite Halloysite (hydrated) Halloysite (dehydrated) Attapulgite Allophane Activity, A 0.52 0.36 0.42 0.89 4.5 1.33 0.33 Liquid limit, LL 35-100 60-120 100-900 Undisturbed shear strength (kN/m²) 50-70 40-55 150-250 200-250 18 17 41 29 46 36 38 a. Estimate the plasticity index for each soil using Skempton's definition of activity. b. Estimate the probable mineral composition of the clay soils based on plasticity index and activity using the table below. Plastic limit, PL 20-40 35-60 50-100 Sensitivity, S, 14 40-60 30-45 100-125 120-150 2.5 17 2.2 5.3 7.6 150 Activity, A 0.3-0.5 0.5-1.2 1.5-7.0 0.1-0.2 0.4-0.6 0.4-1.3 0.4-1.3 c. Sensitivity refers to the…arrow_forwardB. ( A Soil Specimen has the following characteristics: % passing No.4 sieve = 85 % passing No.200 sieve = 11 D60 = 2 mm D30 = 0.35 mm D10 = 70 μm L.L = 36% P.L = 31% D8 = 2 μm 1. Classify the specimen according to the Unified Soil Classification System (USCS). Assign the group name and the group symbol. 2. Determine the soil activity. 3. Determine the soil Liquidity index and consistency index if we = 26%. Jarrow_forward
- The same soil sample has a natural moisture content of 30% and was subject to the Atterberg Limits test. The plastic limit was measured as 27 while the liquid limit test shows the results in the table below. Number of Blows 42 26 10 Moisture Content 20 32 45 a. Determine the liquid limit of the soil sample. Show and briefly explain how you got the answer. b. Solve and describe the Plasticity Index of the soil sample. c. Determine value and soil state of the liquidity index of the soil sample. d. Determined and describe the clay activity of the soil sample.arrow_forwardA liquid limit test on a clay was performed with the following results. The natural water content of the clay is 38% and plastic limit is 21%. Number of Blows 6 12 20 28 32 Water content (%) 52.5 47.1 42.3 38.6 37.5 What is the plasticity index of this clay? (Use Interpolation) Group of answer choices 15.74% 18.99% 18.85% 17.63% Please answer this asap for upvote. thanksarrow_forwardU B. ( A Soil Specimen has the following characteristics: % passing No.4 sieve = 85 % passing No.200 sieve = 11 D60 = 2 mm D30 = 0.35 mm D₁0 = 70 μm L.L = 36% P.L = 31% D8 = 2 µm 1. Classify the specimen according to the Unified Soil Classification System (USCS). Assign the group name and the group symbol. 2. Determine the soil activity. 3. Determine the soil Liquidity index and consistency index if we = 26%.arrow_forward
- As a result of sieve analysis and hydrometer analysis on a soil sample, gravel 40% and sand 18%. Liquid limit value of the soil 58% and plasticity index was determined as 32%. D60, D30 and D10 values according to grain distribution curve 2.4mm, 0.9mm and 0.2mm respectively. According to the findings obtained, the soil sample Make USCS classification.arrow_forwardA hydrometer test was conducted on the material passing sieve No, 200 and the results are listed in the table below, The results of sieve analysis on the soil showed that the percentage passing No. 4 was 90 % and that passing No. 200 was 20 %. Estimate the clay size fraction in the soil. Table : Results of hydrometer test diameter (mm) 0.0700 0.0400 0.0150 0.0020 % finer (combined) 19 finer 95 80 16 65 13 45 0.0010 30 6 Select one:arrow_forwardA soil sample has 36 g of soil solids, 14 cm³ of voids, 11 g of water and specific gravity of soil grains is 2.6. Consider the following statements in this regard: a) The water content is 30.56 % b) The void ratio is 1.01 c) Degree of saturation is x 100 = 42.31% d) The porosity is 0.50 Which of these statements are correct?arrow_forward
- (b) Classification tests for the determination of the particle size distribution of a soil produced the following results: Particle Size % finer (mm) 99 2.36 80 1.3 63 0.6 33 0.2 10 0.075 3 0.02 Then using cone penetrometer for Liquid Limit test, the results were recorded as follows. Cone penetration 15.9 17.7 19.1 20.3 22.5 (mm) Water 32.6 42.9 51.6 59.8 66.2 content (%) While the plastic limit test conducted for the same soil recorded as below:- Test No. 1 2 3 Wet soil 10.01 11.23 9.72 Dry soil 8.02 9.01 7.72 SKAA 1713 4 i) Plot the grain size distribution curve on the log graph that has been provided (Figure 2b). Calculate the uniformity coefficient, Cu and the coefficient of gradation, C, for the soil sample. Determine the plastic limit, the liquid limit and the plasticity index of the soil. Plot the graph to help you obtain the results (if necessary). ii) iii)arrow_forwardA Liquid Limit test was carried out on a sample of Clay with the following results: Number of taps 6. 12 26 28 31 Moisture Content 53.4 52.2 48.3 40.0 38.8 37.1 (%6) The results from the Plastic Limit test gave the Plastic Limit of 28%. Determine: a) the Liquid Limit b) the Plasticity Index of the soil c) and Classify the soilarrow_forwardThe total volume of a soil specimen is 80,000 mm^3 and has a mass of 152 g. the dry mass of the specimen is 122g, and the density of the soil is 2.65 Mg/m^3. Compute the following index properties: (a) e; (b) n; (c) S; (d) ρt; and (e) ρd. Include phase diagrams.arrow_forward
 Principles of Geotechnical Engineering (MindTap C...Civil EngineeringISBN:9781305970939Author:Braja M. Das, Khaled SobhanPublisher:Cengage Learning
 Principles of Foundation Engineering (MindTap Cou...Civil EngineeringISBN:9781337705028Author:Braja M. Das, Nagaratnam SivakuganPublisher:Cengage Learning