
PRIN.OF GEOTECHNICAL...-MINDTAP(2 SEM)
9th Edition
ISBN: 9781305971271
Author: Das
Publisher: CENGAGE L
expand_more
expand_more
format_list_bulleted
Concept explainers
Videos
Textbook Question
Chapter 4, Problem 4.5P
The following data were obtained by conducting liquid limit and plastic limit tests on a soil collected from the site.
Liquid limit tests:
Plastic limit test: PL = 19.3%
a. Draw the flow curve and determine the liquid limit.
b. Using the Casagrande plasticity chart (Figure 4.21), determine the soil type.
Expert Solution & Answer

Trending nowThis is a popular solution!

Students have asked these similar questions
During Atterberg limit tests in the soil mechanics laboratory, the students obtained the following results from a
clayey soil.
Liquid limit test:
Number of
blows, N
Mosture
content (%)
12
35.2
19
29.5
27
25.4
37
21
Draw the flow curve and obtain the liquid limit.
• If plasticity index of the soil is 6.5 what is the plastic limit of this soil?
• Determine the flow index.
• Determine the liquidity index of the soil if the in-situ moisture content is 23.8%, and comment on the
probable engineering behavior of this soil.
Following are the results from the liquid and plastic limit tests for a soil.
Liquid limit test:
let the N1 be 20 and w1 be 30%
let N2 be 30 and w2 be 20%
let N3 be 40 and w3 be 10%
For Plastic limit test:
let w1 be 12 and let w2 be 13 and let w3 be 13.5
The liquid limit =
Plastic limit =
Plasticity Index =
The test results of a soil sample are given
below.
Percentage finer than 4.75 mm = 55
Percentage finer than 0.075 mm = 25
Liquid limit = 34%
Plastic limit = 25%.
The soil classification as per Indian
standards is
(a) GM
(c) SM
(b) GC
(d) SC
Chapter 4 Solutions
PRIN.OF GEOTECHNICAL...-MINDTAP(2 SEM)
Ch. 4 - During Atterberg limit tests in the soil mechanics...Ch. 4 - Prob. 4.2PCh. 4 - Prob. 4.3PCh. 4 - Results from a liquid limit test conducted on a...Ch. 4 - The following data were obtained by conducting...Ch. 4 - Refer to the soil in Problem 4.5. Using the...Ch. 4 - Following results are obtained for a liquid limit...Ch. 4 - Prob. 4.8PCh. 4 - Prob. 4.9PCh. 4 - Prob. 4.10P
Knowledge Booster


Learn more about
Need a deep-dive on the concept behind this application? Look no further. Learn more about this topic, civil-engineering and related others by exploring similar questions and additional content below.Similar questions
- B. ( A Soil Specimen has the following characteristics: % passing No.4 sieve = 85 % passing No.200 sieve = 11 D60 = 2 mm D30 = 0.35 mm D10 = 70 μm L.L = 36% P.L = 31% D8 = 2 μm 1. Classify the specimen according to the Unified Soil Classification System (USCS). Assign the group name and the group symbol. 2. Determine the soil activity. 3. Determine the soil Liquidity index and consistency index if we = 26%. Jarrow_forwardSr B. ( A Soil Specimen has the following characteristics: % passing No.4 sieve = 85 % passing No.200 sieve = 11 D60 = 2 mm D30=0.35 mm D₁0 = 70 μm D8=2 μm L.L = 36% P.L = 31% 1. Classify the specimen according to the Unified Soil Classification System (USCS). Assign the group name and the group symbol. 2. Determine the soil activity. 3. Determine the soil Liquidity index and consistency index if wc = 26%.arrow_forwardA soil sample was determine in the laboratory tohave a liquid limit of 41% and a plastic limit of21.1%. if the water content is 30%, determine thefollowing:a. Plasticity indexb. Liquidity indexc. What is the characteristics of soil?-liquid-plastic-dense-brittle solidarrow_forward
- Afalling-head permeability test is performed on a fine-grained soil. The soil sample has a length of 120 mm and a cross-sectional area of 600 mm2. The water in the standpipe flowing into the soil is 0.60 m above the top of the sample at the start of the test. It falls 50 mm in 30 minutes. The standpipe has a cross-sectional area of 200 mm2. (a) Make a sketch of the described conditions. (b) What is the coefficient of permeability in millimeters per second? (c) What is the coefficient of permeability in feet per minute? (d) On the basis of the calculated value for khyd, what is the probable soil type?arrow_forwardA liquid limit test on a clay was performed with the following results. The natural water content of the clay is 38% and plastic limit is 21%. Number of Blows 6 12 20 28 32 Water content (%) 52.5 47.1 42.3 38.6 37.5 What is the liquidity index of this clay? (Use Interpolation) Group of answer choices 0.895 0.96 1.08 0.90 Please answer this asap. For upvote. Thanksarrow_forwardProblem 5.arrow_forward
- 2a. The following data was obtained from Liquid Limit Test conducted at a Soil Lab. Using the data given in Table 01, determine the following; Liquid Limit Determination Specimen No. No. of Blows Wt. of Container Wt. of Container + Wet Soil Wt. of Container + Dry Soil i. ii. Unit 1 14 (g) 7.17 (g) 27.97 (9) 21.37 2 20 7.37 27.37 21.27 3 28 7.77 28.47 22.37 4 32 10.97 30.17 24.67 I Determine the Liquid Limit and Flow Index If Plastic Limit of this soil is 22. Classify the soil based on BS Soil Classification system. 5 39 7.27 26.57 21.17arrow_forwardRefer to the soil in Problem 4.5. Using the Casagrande plasticity chart, graphically estimate the shrinkage limit of the soil as shown in Figure 4.22. 4.5 The following data were obtained by conducting liquid limit and plastic limit tests on a soil collected from the site. Liquid limit tests: Plastic limit test: PL = 19.3% a. Draw the flow curve and determine the liquid limit. b. Using the Casagrande plasticity chart (Figure 4.21), determine the soil type.arrow_forwardFollowing results are obtained for a liquid limit test using a fall cone device. Estimate the liquid limit of the soil and the flow index.arrow_forward
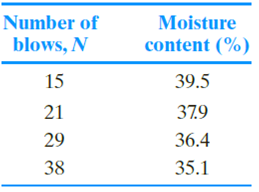
- Results from a liquid limit test conducted on a soil are given below. a. Determine the liquid limit of the soil. b. If it is known that the PI = 6.5, what would be the plastic limit of the soil? c. Determine the liquidity index of the soil if win situ = 23.8%arrow_forwardProblem Set 4 4. The following data were obtained from the liquid and plastic limit tests for a soil: Liquid Limit Test: Number of blows (N) Molsture content (%) a) Draw the flow curve from the liquid limit test data and find the liquid limit. (use excel to graph) b) What is the plasticity index of 17 42.1 22 38.2 27 36.2 32 34.1 Plastic Limit Test: Moisture content = 21.3% the soil?arrow_forwardHomework 1-Results from liquid and plastic limit tests conducted on a soil are Moisture given below. Plastic limit tests: PL 13.4% a) Draw the flow curve and obtain the liquid limit. b) What is the plasticity index of the soil? C) Determine the liquidity index of the soil if Win situ = 32% Number of blows, N content (%) 39.2 %3D 15 34.5 22 26 31.2 29.0 %3D 29 U.S. sieve no. Mass of soil retained 1- The followiarrow_forward
arrow_back_ios
SEE MORE QUESTIONS
arrow_forward_ios
Recommended textbooks for you
 Principles of Geotechnical Engineering (MindTap C...Civil EngineeringISBN:9781305970939Author:Braja M. Das, Khaled SobhanPublisher:Cengage Learning
 Traffic and Highway EngineeringCivil EngineeringISBN:9781305156241Author:Garber, Nicholas J.Publisher:Cengage Learning
 Fundamentals of Geotechnical Engineering (MindTap...Civil EngineeringISBN:9781305635180Author:Braja M. Das, Nagaratnam SivakuganPublisher:Cengage Learning
Principles of Geotechnical Engineering (MindTap C...
Civil Engineering
ISBN:9781305970939
Author:Braja M. Das, Khaled Sobhan
Publisher:Cengage Learning
Traffic and Highway Engineering
Civil Engineering
ISBN:9781305156241
Author:Garber, Nicholas J.
Publisher:Cengage Learning
Fundamentals of Geotechnical Engineering (MindTap...
Civil Engineering
ISBN:9781305635180
Author:Braja M. Das, Nagaratnam Sivakugan
Publisher:Cengage Learning
How Are Highways Designed?; Author: Practical Engineering;https://www.youtube.com/watch?v=9XIjqdk69O4;License: Standard Youtube License