
Videos
A round aluminum alloy bar with a 0.25-in. diameter and a 1-in. gauge length was tested in tension to fracture according to ASTM E-8 method. The load and deformation data were as shown in Table P4.8.
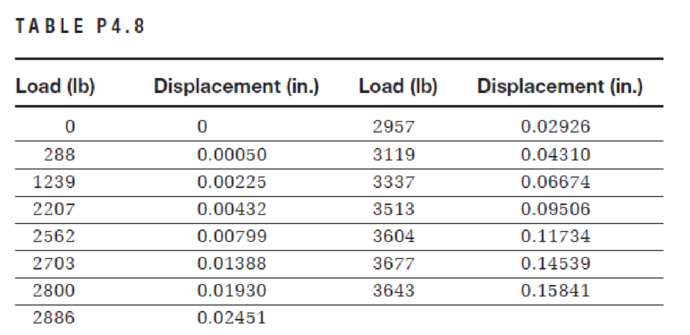
Using a spreadsheet program, obtain the following:
a. A plot of the stress–strain relationship. Label the axes and show units.
b. A plot of the linear portion of the stress–strain relationship. Determine modulus of elasticity using the best fit approach.
c. Proportional limit.
d. Yield stress at an offset strain of 0.002 in/in.
e. Initial tangent modulus.
f. If the specimen is loaded to 3200 lb only and then unloaded, what is the permanent change in gauge length?
g. When the applied load was 1239 lb, the diameter was measured as 0.249814 in. Determine Poisson’s ratio.
Want to see the full answer?
Check out a sample textbook solution
Chapter 4 Solutions
Materials for Civil and Construction Engineers (2nd Edition)


- The data in Table 1.5.3 were obtained from a tensile test of a metal specimen with a rectangular cross section of 0.2011in.2 in area and a gage length (the length over which the elongation is measured) of 2.000 inches. The specimen was not loaded to failure. a. Generate a table of stress and strain values. b. Plot these values and draw a best-fit line to obtain a stress-strain curve. c. Determine the modulus of elasticity from the slope of the linear portion of the curve. d. Estimate the value of the proportional limit. e. Use the 0.2 offset method to determine the yield stress.arrow_forwardThe results of a tensile test are shown in Table 1.5.2. The test was performed on a metal specimen with a circular cross section. The diameter was 3 8 inch and the gage length (The length over which the elongation is measured) was 2 inches. a. Use the data in Table 1.5.2 to produce a table of stress and strain values. b. Plot the stress-strain data and draw a best-fit curve. c. Compute the, modulus of elasticity from the initial slope of the curve. d. Estimate the yield stress.arrow_forwardA tensile test was performed on a metal specimen having a circular cross section with a diameter 0. 510 inch. For each increment of load applied, the strain was directly determined by means of a strain gage attached to the specimen. The results are, shown in Table: 1.5.1. a. Prepare a table of stress and strain. b. Plot these data to obtain a stress-strain curve. Do not connect the data points; draw a best-fit straight line through them. c. Determine the modulus of elasticity as the slope of the best-fit line.arrow_forward
- A cylindrical specimen of aluminum alloy having a diameter of 12.8 mm and a gauge length (lo) of 50.800 mm is pulled in tension. Use the load–elongation characteristics shown in the following table and answer the following questions. (10p) i- Convert the data as engineering stress (σ) versus engineering strain (ε). ii- Compute the modulus of elasticity (E) (with a precision of ±5000 MPa) iii- Determine the yield strength at a strain offset of 0.002 (σy) (with a precision of ±20 MPa) iv- Determine the tensile strength (TS) of this alloy.arrow_forwardA cylindrical specimen of stainless steel having an initial diameter of 12.8?? and initial length of 50.8?? is pulled in tension. Use the data provided below to a) Plot the data as engineering stress versus engineering strain using excel or similar software. b) Compute the modulus of elasticity. c) Determine the yield strength at a strain offset of 0.002. d) Determine the tensile strength of this alloy. e) What is the approximate ductility, in percent elongation? f) Compute the modulus of resilience. Load (?) Length (??) 0 50.800 12,700 50.825 25,400 50.851 38,100 50.876 50,800 50.902 76,200 50.952 89,100 51.003 92,700 51.054 102,500 51.181 107,800 51.308 119,400 51.562 128,300 51.816 149,700 52.832 159,000 53.848 160,400 54.356 159,500 54.864 151,500 55.880 124,700 56.642 Fracturearrow_forwardA 32-mm rebar with a gauge length of 200 mm was subjected to tension to fracture according to ASTM E-8 method. The load and deformation data were as shown in TableUsing a spreadsheet program obtain the following:a. A plot of the stress–strain relationship. Label the axes and show units.b. A plot of the linear portion of the stress–strain relationship. Determine modulus of elasticity using the best-fit approach.c. Proportional limit.d. Yield stress.e. Ultimate strength.f. If the rebar is loaded to 390 kN only and then unloaded, what is the permanent change in length?arrow_forward
- A high-yield-strength alloy steel bar with a rectangular cross section that has a width of 37.5 mm, a thickness of 6.25 mm, and a gauge length of 203 mm was tested in tension to rupture, according to ASTM E-8 method. The load and deformation data were as shown in Table Using a spreadsheet program, obtain the following:a. A plot of the stress–strain relationship. Label the axes and show units.b. A plot of the linear portion of the stress–strain relationship. Determine modulus of elasticity using the best-fit approach.c. Proportional limit.d. Yield stress.e. Ultimate strength.f. If the specimen is loaded to 155 kN only and then unloaded, what is the permanent deformation?g. In designing a typical structure made of this material, would you expect the stress applied in (f) safe? Why?arrow_forwardAn aluminum alloy bar with a radius of 7 mm was subjected to tension until fracture and produced results shown in Table P4.3. a. Using a spreadsheet program, plot the stress–strain relationship. b. Calculate the modulus of elasticity of the aluminum alloy. c. Determine the proportional limit. d. What is the maximum load if the stress in the bar is not to exceed the proportional limit? e. Determine the 0.2% offset yield strength. f. Determine the tensile strength. g. Determine the percent of elongation at failure.arrow_forwardhree steel bars with a diameter of 25 mm and carbon contents of 0.2, 0.5, and 0.8%, respectively. The specimens were subjected to tension until rupture. The load versus deformation results were as shown in Table P3.19. If the gauge length is 50 mm, determine the following: The tensile stresses and strains for each specimen at each load increment. Plot stresses versus strains for all specimens on one graph. The proportional limit for each specimen. The 0.2% offset yield strength for each specimen. The modulus of elasticity for each specimen. The strain at rupture for each specimen. Comment on the effect of increasing the carbon content on the following: Yield strength ii. Modulus of elasticity iii. Ductilityarrow_forward
- A cylindrical specimen of stainless steel having a diameter of 12.8 mm (0.505 in.) and a gauge length of 50.800 mm (2.000 in.) is pulled in tension. Use the load–elongation characteristics shown in the following table to answer the following: a. Plot the data as engineering stress versus engineering strain. b. Compute the modulus of elasticity. 66 c. Determine the yield strength at a strain offset of 0.002. d. Determine the tensile strength of this alloy. e. What is the approximate ductility, in percent elongation? f. Compute the modulus of resiliencearrow_forwardCalculate the total deformation of steelbars shown in Figure. (d1=15 mm, d2=25 mm and E=210 GPa) A= 5, B=3, C=8arrow_forwardA cylindrical specimen of stainless steel having a diameter of 12.8 mm (0.505 in.) and a gauge length of 50.800 mm (2.000 in.) is pulled in tension. Use the load–elongation characteristics shown in the following table: (see attached picture) (a) Plot the data as engineering stress versus engineering strain. (b) Compute the modulus of elasticity. (c) Determine the yield strength at a strain offset of 0.002.(d) Determine the tensile strength of this alloy.e) What is the approximate ductility, in percent elongation? (f) Compute the modulus of resilience.arrow_forward
 Steel Design (Activate Learning with these NEW ti...Civil EngineeringISBN:9781337094740Author:Segui, William T.Publisher:Cengage Learning
 Materials Science And Engineering PropertiesCivil EngineeringISBN:9781111988609Author:Charles GilmorePublisher:Cengage Learning