Elementary Statistics Third California Edition
3rd Edition
ISBN: 9781323578179
Author: Triola
Publisher: PEARSON C
expand_more
expand_more
format_list_bulleted
Videos
Textbook Question
Chapter 4, Problem 5RE
In Exercises 1–10, use the data in the accompanying table and express all results in decimal form. (The data are from “Mortality Reduction with Air Bag and Seat Belt Use in Head-On Passenger Car Collisions,” by Crandall, Olson, and Sklar, American Journal of Epidemiology, Vol. 153, No. 3.)
Drivers Involved in Head-On Collision of Passenger Cars
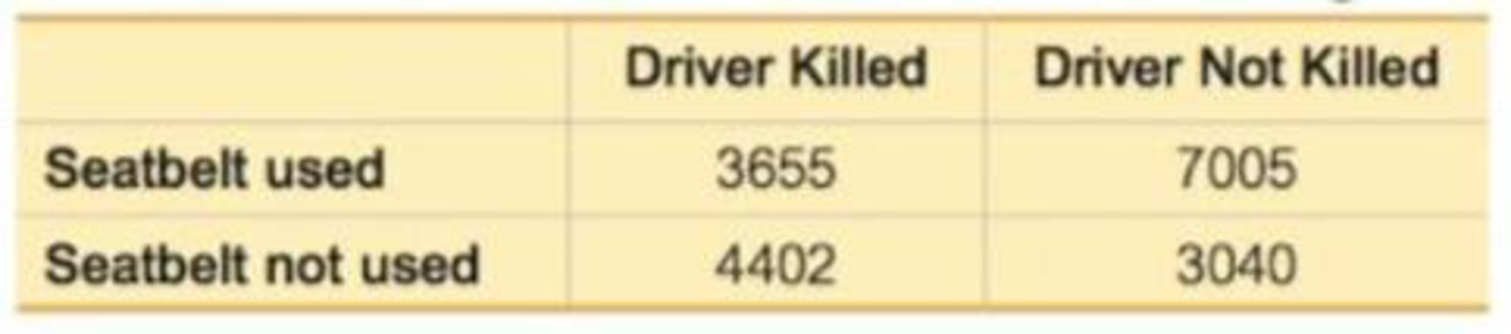
5. No Seatbelt or Driver Not Killed If one of the drivers is randomly selected, find the probability of getting someone who did not use a seatbelt or was not killed.
Expert Solution & Answer
Want to see the full answer?
Check out a sample textbook solution
Students have asked these similar questions
A prospective cohort study is run to estimate the incidence of stroke in persons 55 years of age and older. All participants are free of stroke at study start. Each participant is followed for a maximum of 5 years. The data are summarized in Table 3–14.
Number of Strokes
Number of Stroke-Free Person-Years
Men (n = 125)
9
478
Women (n = 200)
21
97
What is the annual incidence rate of stroke in men?
What is the annual incidence rate of stroke in women?
What is the annual incidence rate of stroke (men and women combined)?
A researcher believes that the so-called “sugar high” is not real. He gathered 30 adolescents and recorded their activity level in the scale of 0 – 100 (0 = not active and 100 = super active). First, he recorded participants’ activity level before they consumed candy. After recording their pre-sugar activity level, the researcher gave out 5 Snickers bars to participants. Then, he recorded their post-sugar activity level. The average difference between post-sugar and pre-sugar activity level is 50 (i.e., the activity levels are higher after sugar than prior to it) with a standard deviation of 10.
A). What is the type of test you will use? (z-test, single-sample t-test, paired-samples t-test, or independent samples t-test) and why (what information provided in the problem)B). What are the hypotheses (Be Specific)
A researcher believes that the so-called “sugar high” is not real. He gathered 30 adolescents and recorded their activity level in the scale of 0 – 100 (0 = not active and 100 = super active). First, he recorded participants’ activity level before they consumed candy. After recording their pre-sugar activity level, the researcher gave out 5 Snickers bars to participants. Then, he recorded their post-sugar activity level. The average difference between post-sugar and pre-sugar activity level is 50 (i.e., the activity levels are higher after sugar than prior to it) with a standard deviation of 10.
A). Complete test statistic and critical values
B). Conclusion
Chapter 4 Solutions
Elementary Statistics Third California Edition
Ch. 4.1 - New Jersey Lottery Let A denote the event of...Ch. 4.1 - Probability Rewrite the following statement so...Ch. 4.1 - Interpreting Weather While this exercise was being...Ch. 4.1 - Subjective Probability Estimate the probability...Ch. 4.1 - Identifying Probability Values Which of the...Ch. 4.1 - Penicillin Who discovered penicillin: Sean Penn,...Ch. 4.1 - Avogadro Constant If you are asked on a quiz to...Ch. 4.1 - Births Example 2 in this section includes the...Ch. 4.1 - In Exercises 9-12, assume that 50 births are...Ch. 4.1 - In Exercises 9-12, assume that 50 births are...
Ch. 4.1 - In Exercises 9-12, assume that 50 births are...Ch. 4.1 - In Exercises 9-12, assume that 50 births are...Ch. 4.1 - In Exercises 13-20, express the indicated degree...Ch. 4.1 - SAT Test When making a random guess for an answer...Ch. 4.1 - In Exercises 13-20, express the indicated degree...Ch. 4.1 - In Exercises 13-20, express the indicated degree...Ch. 4.1 - Randomness When using a computer to randomly...Ch. 4.1 - In Exercises 13-20, express the indicated degree...Ch. 4.1 - In Exercises 13-20, express the indicated degree...Ch. 4.1 - In Exercises 13-20, express the indicated degree...Ch. 4.1 - In Exercises 21-24, refer to the sample data in...Ch. 4.1 - In Exercises 21-24, refer to the sample data in...Ch. 4.1 - In Exercises 21-24, refer to the sample data in...Ch. 4.1 - In Exercises 21-24, refer to the sample data in...Ch. 4.1 - In Exercises 25-32, find the probability and...Ch. 4.1 - In Exercises 25-32, find the probability and...Ch. 4.1 - In Exercises 25-32, find the probability and...Ch. 4.1 - In Exercises 25-32, find the probability and...Ch. 4.1 - In Exercises 25-32, find the probability and...Ch. 4.1 - In Exercises 25-32, find the probability and...Ch. 4.1 - In Exercises 25-32, find the probability and...Ch. 4.1 - In Exercises 25-32, find the probability and...Ch. 4.1 - Probability from a Sample Space. In Exercises...Ch. 4.1 - Probability from a Sample Space. In Exercises...Ch. 4.1 - Probability from a Sample Space. In Exercises...Ch. 4.1 - Probability from a Sample Space. In Exercises...Ch. 4.1 - Using Probability to Form Conclusions. In...Ch. 4.1 - Using Probability to Form Conclusions. In...Ch. 4.1 - Using Probability to Form Conclusions. In...Ch. 4.1 - Using Probability to Form Conclusions. In...Ch. 4.1 - Kentucky Pick 4 In the Kentucky Pick 4 lottery,...Ch. 4.1 - Finding Odds in Roulette A roulette wheel has 38...Ch. 4.1 - Kentucky Derby Odds When the horse California...Ch. 4.1 - Relative Risk and Odds Ratio In a clinical trial...Ch. 4.2 - Notation When randomly selecting an adult, A...Ch. 4.2 - Notation When randomly selecting adults, let M...Ch. 4.2 - Sample for a Poll There are 15,524,971 adults in...Ch. 4.2 - Rule of Complements When randomly selecting an...Ch. 4.2 - Finding Complements. In Exercises 5-8, find the...Ch. 4.2 - Finding Complements. In Exercises 5-8, find the...Ch. 4.2 - Finding Complements. In Exercises 5-8, find the...Ch. 4.2 - Finding Complements. In Exercises 5-8, find the...Ch. 4.2 - In Exercises 9-20, use the data in the following...Ch. 4.2 - In Exercises 9-20, use the data in the following...Ch. 4.2 - In Exercises 9-20, use the data in the following...Ch. 4.2 - In Exercises 9-20, use the data in the following...Ch. 4.2 - In Exercises 9-20; use the data in the following...Ch. 4.2 - In Exercises 9-20, use the data in the following...Ch. 4.2 - In Exercises 9-20, use the data in the following...Ch. 4.2 - In Exercises 9-20, use the data in the following...Ch. 4.2 - In Exercises 9-20, use the data in the following...Ch. 4.2 - In Exercises 9-20, use the data in the following...Ch. 4.2 - In Exercises 9-20, use the data in the following...Ch. 4.2 - In Exercises 9-20, use the data in the following...Ch. 4.2 - In Exercises 21-24, use these results from the...Ch. 4.2 - In Exercises 21-24, use these results from the...Ch. 4.2 - In Exercises 21-24, use these results from the...Ch. 4.2 - In Exercises 21-24, use these results from the...Ch. 4.2 - Redundancy. Exercises 25 and 26 involve...Ch. 4.2 - Redundancy. Exercises 25 and 26 involve...Ch. 4.2 - Acceptance Sampling. With one method of a...Ch. 4.2 - Acceptance Sampling. With one method of a...Ch. 4.2 - In Exercises 29 and 30, find the probabilities and...Ch. 4.2 - Prob. 30BSCCh. 4.2 - Surge Protectors Refer to the accompanying figure...Ch. 4.2 - Prob. 32BBCh. 4.2 - Exclusive Or The exclusive or means either one or...Ch. 4.2 - Complements and the Addition Rule Refer to the...Ch. 4.3 - Language: Complement of At Least One Let A = the...Ch. 4.3 - Probability of At Least One Let A = the event of...Ch. 4.3 - Notation When selecting one of your Facebook...Ch. 4.3 - Notation When selecting one of your Facebook...Ch. 4.3 - At Least One. In Exercises 5-12, find the...Ch. 4.3 - Probability of a Girl Assuming that boys and girls...Ch. 4.3 - At Least One. In Exercises 5-12, find the...Ch. 4.3 - At Least One. In Exercises 5-12, find the...Ch. 4.3 - At Least One. In Exercises 5-12, find the...Ch. 4.3 - At Least One. In Exercises 5-12, find the...Ch. 4.3 - At Least One. In Exercises 5-12, find the...Ch. 4.3 - At Least One. In Exercises 5-12, find the...Ch. 4.3 - Denomination Effect. In Exercises 13-16, use the...Ch. 4.3 - Denomination Effect. In Exercises 13-16, use the...Ch. 4.3 - Denomination Effect. In Exercises 13-16, use the...Ch. 4.3 - Denomination Effect. In Exercises 13-16, use the...Ch. 4.3 - In Exercises 17-20, refer to the accompanying...Ch. 4.3 - In Exercises 17-20, refer to the accompanying...Ch. 4.3 - In Exercises 17-20, refer to the accompanying...Ch. 4.3 - In Exercises 17-20, refer to the accompanying...Ch. 4.3 - Redundancy in Computer Hard Drives Assume that...Ch. 4.3 - Redundancy in Stadium Generators Large stadiums...Ch. 4.3 - Composite Drug Test Based on the data in Table 4-1...Ch. 4.3 - Composite Water Samples The Fairfield County...Ch. 4.3 - Shared Birthdays Find the probability that of 25...Ch. 4.4 - Notation What does the symbol ! represent? Six...Ch. 4.4 - New Jersey Pick 6 In the New Jersey Pick 6 lottery...Ch. 4.4 - Oregon Pick 4 In the Oregon Pick 4 lottery game, a...Ch. 4.4 - Combination Lock The typical combination lock uses...Ch. 4.4 - In Exercises 536, express all probabilities as...Ch. 4.4 - Social Security Numbers A Social Security number...Ch. 4.4 - Quinela In a horse race, a quinela bet is won if...Ch. 4.4 - Soccer Shootout In soccer, a tie at the end of...Ch. 4.4 - Grading Exams Your professor has just collected...Ch. 4.4 - Radio Station Call Letters If radio station call...Ch. 4.4 - Scheduling Routes A presidential candidate plans...Ch. 4.4 - Survey Reliability A survey with 12 questions is...Ch. 4.4 - Safety with Numbers The author owns a safe in...Ch. 4.4 - Electricity When testing for current in a cable...Ch. 4.4 - Sorting Hat At Hogwarts School of Witchcraft and...Ch. 4.4 - Moving Company The United Van Lines moving company...Ch. 4.4 - Powerball As of this writing, the Powerball...Ch. 4.4 - Teed Off When four golfers are about to begin a...Ch. 4.4 - ZIP Code If you randomly select five digits, each...Ch. 4.4 - FedEx Deliveries With a short time remaining in...Ch. 4.4 - Phone Numbers Current rules for telephone area...Ch. 4.4 - Classic Counting Problem A classic counting...Ch. 4.4 - Corporate Officers and Committees The Digital Pet...Ch. 4.4 - ATM You want to obtain cash by using an ATM, but...Ch. 4.4 - Party Mix DJ Marty T is hosting a party tonight...Ch. 4.4 - Identity Theft with Credit Cards Credit card...Ch. 4.4 - What a Word! One of the longest words in standard...Ch. 4.4 - Phase I of a Clinical Trial A clinical test on...Ch. 4.4 - Mega Millions As of this writing, the Mega...Ch. 4.4 - Designing Experiment Clinical trials of Nasonex...Ch. 4.4 - Morse Codes The International Morse code is a way...Ch. 4.4 - Mendels Peas Mendel conducted some his famous...Ch. 4.4 - Change for a Quarter How many different ways can...Ch. 4.4 - Counting with Fingers How many different ways can...Ch. 4.4 - Change for a Quarter How many different ways can...Ch. 4.4 - Win 1 Billion Quicken Loans offered a prize of 1...Ch. 4.4 - Computer Variable Names A common computer...Ch. 4.4 - High Fives a. Five mathletes celebrate after...Ch. 4 - Standard Tests Standard tests, such as the SAT or...Ch. 4 - Rain As the author is creating this exercise, a...Ch. 4 - Months If a month is randomly selected after...Ch. 4 - Social Networking Based on data from the Pew...Ch. 4 - Subjective Probability Estimate the probability...Ch. 4 - In Exercises 610, use the following results from...Ch. 4 - In Exercises 610, use the following results from...Ch. 4 - In Exercises 610, use the following results from...Ch. 4 - In Exercises 610, use the following results from...Ch. 4 - In Exercises 610, use the following results from...Ch. 4 - In Exercises 110, use the data in the accompanying...Ch. 4 - In Exercises 110, use the data in the accompanying...Ch. 4 - In Exercises 110, use the data in the accompanying...Ch. 4 - In Exercises 110, use the data in the accompanying...Ch. 4 - In Exercises 110, use the data in the accompanying...Ch. 4 - Prob. 6RECh. 4 - Prob. 7RECh. 4 - In Exercises 110, use the data in the accompanying...Ch. 4 - In Exercises 110, use the data in the accompanying...Ch. 4 - Prob. 10RECh. 4 - Black Cars Use subjective probability to estimate...Ch. 4 - Vision Correction About 75% of the U.S. population...Ch. 4 - National Statistics Day a. If a person is randomly...Ch. 4 - Composite Sampling for Diabetes Currently, the...Ch. 4 - Wild Card Lottery The Wild Card lottery is run in...Ch. 4 - Pennsylvania Cash 5 In the Pennsylvania Cash 5...Ch. 4 - Redundancy Using Braun battery-powered alarm...Ch. 4 - Exacta In a horse race, an exacta bet is won by...Ch. 4 - Fatal Drunk Driving Listed below are the blood...Ch. 4 - Fatal Drunk Driving Use the same data given in...Ch. 4 - Organ Donors USA Today provided information about...Ch. 4 - Sampling Eye Color Based on a study by Dr. P....Ch. 4 - Prob. 5CRECh. 4 - New Lottery Game In the Monopoly Millionaires Club...Ch. 4 - Critical Thinking: Interpreting results from a...Ch. 4 - Critical Thinking: Interpreting results from a...Ch. 4 - Critical Thinking: Interpreting results from a...Ch. 4 - Critical Thinking: Interpreting results from a...Ch. 4 - Critical Thinking: Interpreting results from a...Ch. 4 - Critical Thinking: Interpreting results from a...Ch. 4 - Critical Thinking: Interpreting results from a...Ch. 4 - Critical Thinking: Interpreting results from a...Ch. 4 - Critical Thinking: Interpreting results from a...
Knowledge Booster


Learn more about
Need a deep-dive on the concept behind this application? Look no further. Learn more about this topic, statistics and related others by exploring similar questions and additional content below.Similar questions
- Heart rate during laughter. Laughter is often called “the best medicine,” since studies have shown that laughter can reduce muscle tension and increase oxygenation of the blood. In the International Journal of Obesity (Jan. 2007), researchers at Vanderbilt University investigated the physiological changes that accompany laughter. Ninety subjects (18–34 years old) watched film clips designed to evoke laughter. During the laughing period, the researchers measured the heart rate (beats per minute) of each subject, with the following summary results: Mean = 73.5, Standard Deviation = 6. n=90 (we can treat this as a large sample and use z) It is well known that the mean resting heart rate of adults is 71 beats per minute. Based on the research on laughter and heart rate, we would expect subjects to have a higher heart beat rate while laughing.Construct 95% Confidence interval using z value. What is the lower bound of CI? a) Calculate the value of the test statistic.(z*) b) If…arrow_forwardSophomore, junior, and senior students at a high school will be surveyed regarding a potential increase in the extracurricular student activities fee. There are three possible responses to the survey question - agree with the increase, do not agree with the increase, or no opinion. A chi-square test will be conducted to determine whether the response to this question is independent of the class in which the student is a member. How many degrees of freedom should the chi-square test have?arrow_forwardMajor League Baseball (MLB) consists of teams that play in the American League and the National League. MLB collects a wide variety of team and player statistics. Some of the statistics often used to evaluate pitching performance are as follows: • ERA: The average number of earned runs given up by the pitcher per nine innings. An earned run is any run that the opponent scores off a particular pitcher except for runs scored as a result of errors. • SO/IP: The average number of strikeouts per inning pitched. • HR/IP: The average number of home runs per inning pitched. • R/IP: The number of runs given up per inning pitched. The following data show values for these statistics for a random sample of 20 pitchers from the American League for one full season. Player Тeam W ERA SO/IP HR/IP R/IP Verlander, J DET 24 2.40 1.00 0.09 0.29 Beckett, J BOS 13 7 2.88 0.92 0.12 0.35 Wilson, C TEX 16 7 2.93 0.93 0.08 0.40 Sabathia, C ΝY 19 8. 3.01 0.97 0.06 0.36 Haren, D LAA 16 10 3.16 0.80 0.08 0.37…arrow_forward
- The table below shows the estimated vaccination coverage of adolescents aged 13-17 years, as reported in national surveys in 2020 and 2021. Vaccine Percent vaccinated (95% CI) Tdap (tetanus, diphtheria, and acellular pertussis vaccine) 2020: 90.1 (89.2–90.9) 2021: 89.6 (88.6–90.5) MMR (measles, mumps, and rubella vaccine) 2020: 92.4 (91.6–93.2) 2021: 92.2 (91.2–93.2) HPV (human papillomavirus vaccine) 2020: 58.6 (57.3–60.0) 2021: 61.7 (60.2–63.2) Answer these: a. For which vaccine(s) was there a statistically significant change in coverage from 2020 to 2021? For each, note whether it was a statistically significant increase or decrease? b. For which vaccine(s) was there no significant change in coverage from 2020 to 2021?arrow_forwardO.R data preparation is a trivial step, due to the time required and the possibility of data collection errors. True of fallsarrow_forwardHealth care workers who use latex gloves with glove powder on a daily basis are particularly susceptible to developing a latex allergy. Each in a sample of 44 hospital employees who were diagnosed with a latex allergy based on a skin-prick test reported on their exposure to latex gloves. Summary statistics for the number of latex gloves used per week are x= 19.4 and s = 11.7. Complete parts (a) - (d). a. Give a point estimate for the average number of latex gloves used per week by all health care workers with a latex allergy. b. Form a 95% confidence interval for the average number of latex gloves used per week by all health care workers with a latex allergy. (Use integers or decimals for any numbers in the expression. Round to two decimal places as needed.) c. Give a practical interpretation of the interval, part (b). O A. One can be 95% confident that latex gloves cause allergies for all who use a number of gloves contained in the interval. O B. One can be 95% confident that the…arrow_forward
- Question Number 02: Calculate the CGPA for the subjects from the grades as mentioned in Table 1:Serial Number Courses: Credit Hours Grade Achieved1. Business Analytics 3 B2. Organization Behavior 3 C+3. Pakistan Studies 2 B+4. Business Communication 2 B+5. Cost Accounting 3 C+6. Probability & Statistics 3 C7. SPSS Lab. 1 A Table 1.The corresponding GPA for grades are:A = 4.0 , B+ = 3.5 , B = 3.0 , C+ = 2.5 , C = 2.0 , F = 0.0arrow_forwardA clinical psychologist is interested in the relationship between testosterone level in married males and the quality of their marital relationship. A study is conducted in which the testosterone levels of eight married men are measured. The eight men also fill out a standardized questionnaire assessing quality of marital relationship. The questionnaire scale is 0–25, with higher numbers indicating better relationships. Testosterone scores are in nanomoles/liter of serum. The data are shown below. Subject Number 1 2 3 4 5 6 7 8 Relationship Score 24 15 15 10 19 11 20 19 Testosterone Level 12 13 19 25 M 16 15 21 a. Determine the least-squares regression line for predicting relationship score from testosterone level. b. What percentage of the variance in relationship score is accounted for by the regression equation? c. Can we conclude that there is a significant relationship between the testosterone level…arrow_forwardRefer to the data presented in Exercise 2.86. Note that there were 50% more accidents in the 25 to less than 30 age group than in the 20 to less than 25 age group. Does this suggest that the older group of drivers in this city is more accident- prone than the younger group? What other explanation might account for the difference in accident rates?arrow_forward
- Health care workers who use latex gloves with glove powder on a daily basis are particularly susceptible to developing a latex allergy. Each in a sample of 47 hospital employees who were diagnosed with a latex allergy based on a skin-prick test reported on their exposure to latex gloves. Summary statistics for the number of latex gloves used per week are x = 19.3 and s = 12.3. Complete parts (a) - (d). a. Give a point estimate for the average number of latex gloves used per week by all health care workers with a latex allergy. b. Form a 95% confidence interval for the average number of latex gloves used per week by all health care workers with a latex allergy. (Use integers or decimals for any numbers in the expression. Round to two decimal places as needed.) с. Gi a practical interpretation of the interval, part (b). A. One can be 95% confident that latex gloves cause allergies for all who use a number of gloves contained in the interval. B. One can be 95% confident that the average…arrow_forwardCan someone please help me with part c on question 1?arrow_forwardHealth care workers who use latex gloves with glove powder on a daily basis are particularly susceptible to developing a latex allergy. Each in a sample of 47 hospital employees who were diagnosed with a latex allergy based on a skin-prick test reported on their exposure to latex gloves. Summary statistics for the number of latex gloves used per week are x = 19.7 and s = 12.1. Complete parts (a)-(d). a. Give a point estimate for the average number of latex gloves used per week by all health care workers with a latex allergy. 19.7 b. Form a 95% confidence interval for the average number of latex gloves used per week by all health care workers with a latex allergy. (16.24, 23.16) (Use integers or decimals for any numbers in the expression. Round to two decimal places as needed.) c. Give a practical interpretation of the interval, part (b). OA. One can be 95% confident that the average number of latex gloves used per week by all healthcare workers with latex allergy is greater than the…arrow_forward
arrow_back_ios
SEE MORE QUESTIONS
arrow_forward_ios
Recommended textbooks for you
 MATLAB: An Introduction with ApplicationsStatisticsISBN:9781119256830Author:Amos GilatPublisher:John Wiley & Sons Inc
 Probability and Statistics for Engineering and th...StatisticsISBN:9781305251809Author:Jay L. DevorePublisher:Cengage Learning
 Statistics for The Behavioral Sciences (MindTap C...StatisticsISBN:9781305504912Author:Frederick J Gravetter, Larry B. WallnauPublisher:Cengage Learning
 Elementary Statistics: Picturing the World (7th E...StatisticsISBN:9780134683416Author:Ron Larson, Betsy FarberPublisher:PEARSON
 The Basic Practice of StatisticsStatisticsISBN:9781319042578Author:David S. Moore, William I. Notz, Michael A. FlignerPublisher:W. H. Freeman
 Introduction to the Practice of StatisticsStatisticsISBN:9781319013387Author:David S. Moore, George P. McCabe, Bruce A. CraigPublisher:W. H. Freeman
MATLAB: An Introduction with Applications
Statistics
ISBN:9781119256830
Author:Amos Gilat
Publisher:John Wiley & Sons Inc
Probability and Statistics for Engineering and th...
Statistics
ISBN:9781305251809
Author:Jay L. Devore
Publisher:Cengage Learning
Statistics for The Behavioral Sciences (MindTap C...
Statistics
ISBN:9781305504912
Author:Frederick J Gravetter, Larry B. Wallnau
Publisher:Cengage Learning
Elementary Statistics: Picturing the World (7th E...
Statistics
ISBN:9780134683416
Author:Ron Larson, Betsy Farber
Publisher:PEARSON
The Basic Practice of Statistics
Statistics
ISBN:9781319042578
Author:David S. Moore, William I. Notz, Michael A. Fligner
Publisher:W. H. Freeman
Introduction to the Practice of Statistics
Statistics
ISBN:9781319013387
Author:David S. Moore, George P. McCabe, Bruce A. Craig
Publisher:W. H. Freeman
What Are Research Ethics?; Author: HighSchoolScience101;https://www.youtube.com/watch?v=nX4c3V23DZI;License: Standard YouTube License, CC-BY
What is Ethics in Research - ethics in research (research ethics); Author: Chee-Onn Leong;https://www.youtube.com/watch?v=W8Vk0sXtMGU;License: Standard YouTube License, CC-BY