
Concept explainers
Videos
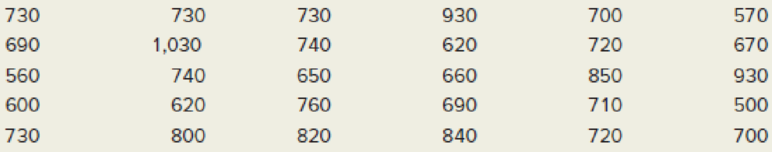
Below are monthly rents paid by 30 students who live off campus. (a) Find the mean, median, and
a.
Find the mean, median and mode of the rent of the students who lived off campus.
Answer to Problem 64CE
The mean, median and mode of the rent of the students who lived off campus are:
| Measures | Values |
| Mean | 724.7 |
| Median | 720 |
| Mode | 730 |
Explanation of Solution
Calculation:
The data set represents the rents of the number of students who live off campus on a sample of 30 students.
Measures of center:
- Mean is defined as sum of observed values divided by the number of observations involved.
- Median is the middle value in an ordered sequence of data.
- Mode is the most frequently occurring value in a data set.
Mean, median and mode:
Software procedure:
Step-by-step procedure to find the mean, the median and the mode using the MINITAB software:
- Choose Stat > Basic Statistics > Display Descriptive Statistics.
- In Variables enter the columns Data.
- Choose option statistics, and select Mean, Median and Mode.
- Click OK.
Output using the MINITAB software is given below:
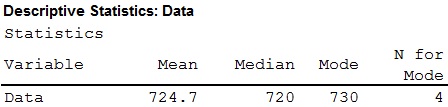
- Thus, the mean, the median and the mode has been obtained.
b.
Explain whether or not the measures of center agreed.
Answer to Problem 64CE
Yes, the measures of center are agreed.
Explanation of Solution
In this situation, the median and the mode obtained are almost equal. Thus, the measures of center will be acceptable for the rent of the students who lived off campus on 30 students.
c.
Find the standard deviation.
Answer to Problem 64CE
The standard deviation is 114.3.
Explanation of Solution
Calculation:
Standard deviation:
Standard deviation is a measure of the deviations that take place in the values of a dataset from the mean in the observation. It is measured by dividing the sum of the squares of deviations of each value from the mean, by the total number of observations and taking square root of this quantity.
Software procedure:
Step-by-step procedure to find the standard deviation using the MINITAB software:
- Choose Stat > Basic Statistics > Display Descriptive Statistics.
- In Variables enter the columns X.
- Choose option statistics, and select Standard deviation.
- Click OK.
Output using the MINITAB software is given below:
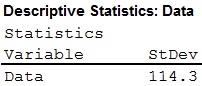
- Thus, the standard deviation has been obtained.
c.
Arrange the data and standardize the data.
Answer to Problem 64CE
The standardized value of rents dataset is given below:
| 0.0464 | 0.0464 | 0.0464 | 1.7962 | -0.2161 | -1.3535 |
| -0.3036 | 2.6710 | 0.1339 | -0.9160 | -0.0411 | -0.4786 |
| -1.4409 | 0.1339 | -0.6535 | -0.5661 | 1.0962 | 1.7962 |
| -1.0910 | -0.9160 | 0.3088 | -0.3036 | -0.1286 | -1.9659 |
| 0.0464 | 0.6588 | 0.8338 | 1.0087 | -0.0411 | -0.2161 |
Explanation of Solution
Here, the data is sorted in the ascending order.
Sorting:
Software procedure:
Step-by-step procedure to sort the data in ascending using the EXCEL is given below:
- Open an EXCEL file.
- Enter the data in the column in A cells A1 to A30.
- Choose Data > Sort.
- In Column drop down box, select Column A.
- In Sort on drop down box, select Values.
- In Order drop down box, select “Smallest to Largest”.
- Click OK.
Thus, the sorted data has been stored in the column in A cells A1 to A30.
Standardized z-score:
Standardized z-score of an observation is defined the number of standard deviations the observation is away from the mean. The standardized z-score is also known as the standard score. The standardized z-score is obtained by,
Where, x denotes the value of the observation,
Standardized values:
Software procedure:
Step-by-step software procedure to obtain standardized values using EXCEL software is as follows:
- Open an EXCEL file.
- Enter the data in the column A in cells A1 to A30.
- In cell B1, enter the formula “=STANDARDIZE(A1, 724.7, 114.3)”.
- Select “ENTER” option.
- Select and copy the cell B1 and drag till the 30th cell.
- Output using EXCEL software is given below:
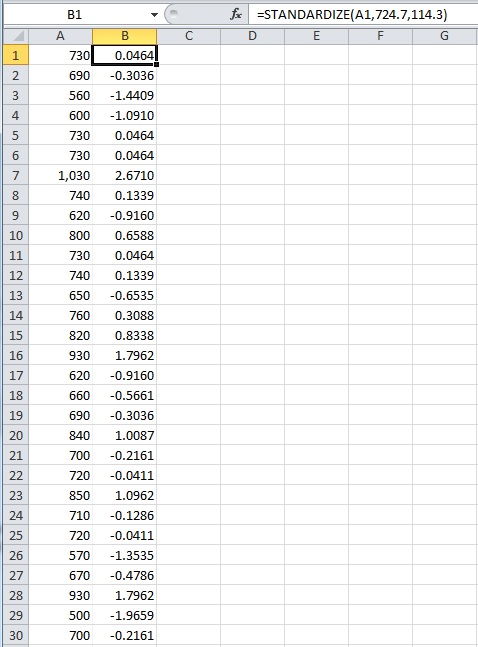
Thus, the standardized values have been obtained using EXCEL.
e.
Check whether the observation has any outlier or unusual observation.
Answer to Problem 64CE
No, there is no outlier, but there is an unusual observation, 1,030.
Explanation of Solution
Calculation:
Based on the standardized z-score, an observation is described as follows:
- Unusual if
- Outlier if
It is observed from the output obtained in previous part (d), the observation 1,030 has the standardized score of 2.67 which is greater than 2 and it is said to be unusual. Therefore, the observation has one unusual value.
f.
Identify whether the observation follows normal population based on Empirical rule.
Answer to Problem 64CE
The distribution of the data set may be approximately normal.
Explanation of Solution
Empirical Rule:
The Empirical Rule for a Normal model states that:
- Within 1 standard deviation of mean, 68.26% of all observations will lie.
- Within 2 standard deviations of mean, 95.44% of all observations will lie.
- Within 3 standard deviations of mean, 99.73% of all observations will lie.
Empirical rule using MEGASTAT:
Software procedure:
Step-by-step software procedure to obtain Empirical rule using Mega Stat software is as follows:
- Open an EXCEL file.
- Enter the data in the column A in cells A1 to A30.
- From the Add-Ins, Select Mega Stat >Descriptive statistics.
- A dialogue box appears.
- In Input range box, select the input range from Sheet1!$A$1:$A$30.
- From the list box, select Empirical rule.
- Click “OK”.
Output obtained using MEGA STAT is as follows:
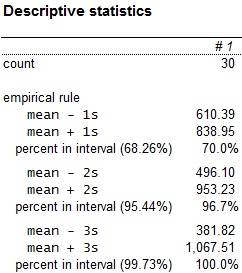
The upper and lower bound for the observation has been obtained using Empirical rule.
Based on the z-scores, the observation has no outliers and has only one unusual observation, that is, the observations with value 1,030 does not lie within the 2-standard deviations limits (496.10 to 953.23). Therefore, the distribution of the data set may be approximately normal.
Want to see more full solutions like this?
Chapter 4 Solutions
APPLIED STATISTICS IN BUSINESS AND ECO


 Glencoe Algebra 1, Student Edition, 9780079039897...AlgebraISBN:9780079039897Author:CarterPublisher:McGraw Hill