
Videos
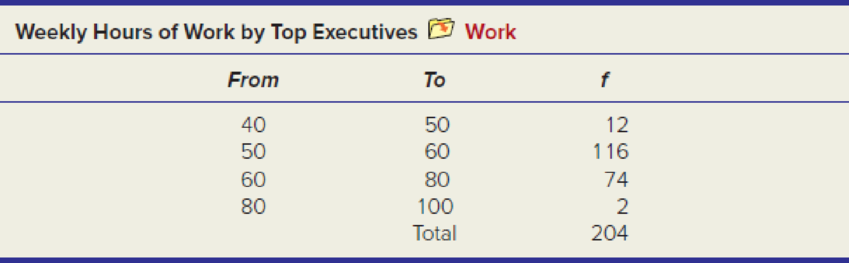
The self-reported number of hours worked per week by 204 top executives is given below. (a) Estimate the
a.
Estimate the mean, standard deviation and coefficient of variation from the grouped data and frequencies.
Answer to Problem 89CE
The mean, standard deviation and coefficient of variation from the grouped data and frequencies are:
| Measures | Values |
| Mean | 60.196 |
| Standard deviation | 8.536 |
| Coefficient of variation | 14.2% |
Explanation of Solution
Calculation:
The given information is about the distribution of number of hours worked per week by 204 top executives.
The mean for the grouped data is:
The standard deviation for the grouped data is:
Where,
n is the total sample size
If
Coefficient of variation:
The coefficient of variation (CV) is a measure of relative variability which is the ratio of the standard deviation to the mean. If the coefficient of variation is high, then level of dispersion around the mean is high. The CV is often expressed as a percentage.
Where, s be the sample standard deviation and
The table below gives the mean for the grouped data:
|
From |
To |
Frequency |
Mid-point | |||
| 40 | 50 | 12 | 540 | 2771.04 | ||
| 50 | 60 | 116 | 6,380 | 3131.768 | ||
| 60 | 80 | 74 | 5,180 | 7112.88 | ||
| 80 | 100 | 2 | 180 | 1776.56 | ||
The mean for the grouped data is:
Substitute the values
Thus, the mean from the grouped data and frequencies is 60.196.
The standard deviation for the grouped data is:
Substitute the values
Thus, the standard deviation from the grouped data and frequencies is 8.536.
The coefficient of variation is:
Substitute
Thus, the CV is 14.18%.
b.
State whether the unequal class size hamper the calculations.
Answer to Problem 89CE
No, the unequal class sizes hamper the calculations.
Explanation of Solution
The unequal sample sizes in the observations disturb the calculations. The unequal class sizes means that none of the class size will hold the value zero.
Want to see more full solutions like this?
Chapter 4 Solutions
APPLIED STATISTICS IN BUSINESS AND ECO


 Glencoe Algebra 1, Student Edition, 9780079039897...AlgebraISBN:9780079039897Author:CarterPublisher:McGraw Hill