APPLIED STATISTICS IN BUSINESS AND ECO
5th Edition
ISBN: 9781260229509
Author: DOANE
Publisher: MCG
bartleby

Concept explainers

bartleby

Videos

Question
Book Icon
Chapter 4, Problem 85CE

a.

To determine

Find the Mean and Standard deviation.

a.

Expert Solution
Check Mark

Answer to Problem 85CE

The Mean and Standard deviation is:

MeasuresWeek 1Week 2Week 3Week 4
Mean50505050
Standard deviation10.6110.6110.6110.61

Explanation of Solution

Calculation:

The data represents the weekend occupancy rates in the nine resort hotels at the time of off season.

For Week 1:

Mean:

Software procedure:

Step-by-step software procedure to obtain Mean using EXCEL software is as follows:

  • Open an EXCEL file.
  • Enter the data in the column I in cells I1 to I9.
  • In cell A1, enter the formula “=AVERAGE(I1:I9)”.
  • Output using EXCEL software is given below:

APPLIED STATISTICS IN BUSINESS AND ECO, Chapter 4, Problem 85CE , additional homework tip  1

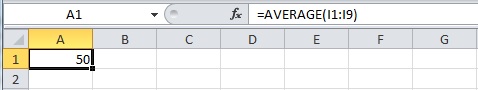
Thus, the mean for Week 1 is 50.

Standard deviation:

Software procedure:

Step-by-step software procedure to obtain Standard deviation using EXCEL software is as follows:

  • Open an EXCEL file.
  • Enter the data in the column I in cells I1 to I9.
  • In cell A1, enter the formula “=STDEV(I1:19)”.
  • Output using EXCEL software is given below:

APPLIED STATISTICS IN BUSINESS AND ECO, Chapter 4, Problem 85CE , additional homework tip  2

Thus, the Standard deviation for Week 1 is 10.61.

For Week 2:

Mean:

Software procedure:

Step-by-step software procedure to obtain Mean using EXCEL software is as follows:

  • Open an EXCEL file.
  • Enter the data in the column J in cells J1 to J9.
  • In cell A1, enter the formula “=AVERAGE(J1:J9)”.
  • Output using EXCEL software is given below:

APPLIED STATISTICS IN BUSINESS AND ECO, Chapter 4, Problem 85CE , additional homework tip  3

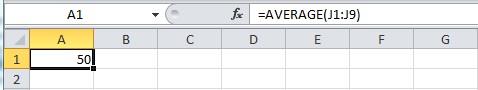
Thus, the mean for the week 2 is 50.

Standard deviation:

Software procedure:

Step-by-step software procedure to obtain Standard deviation using EXCEL software is as follows:

  • Open an EXCEL file.
  • Enter the data in the column J in cells J1 to J9.
  • In cell A1, enter the formula “=STDEV(J1:J9)”.
  • Output using EXCEL software is given below:

APPLIED STATISTICS IN BUSINESS AND ECO, Chapter 4, Problem 85CE , additional homework tip  4

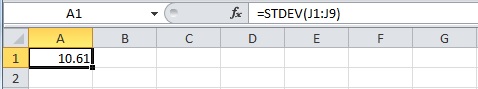
Thus, the Standard deviation for Week 2 is 10.61.

For Week 3:

Mean:

Software procedure:

Step-by-step software procedure to obtain Mean using EXCEL software is as follows:

  • Open an EXCEL file.
  • Enter the data in the column K in cells K1 to K9.
  • In cell A1, enter the formula “=AVERAGE(K1:K9)”.
  • Output using EXCEL software is given below:

APPLIED STATISTICS IN BUSINESS AND ECO, Chapter 4, Problem 85CE , additional homework tip  5

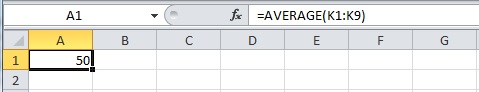
Thus, the mean for Week 3 is 50.

Standard deviation:

Software procedure:

Step-by-step software procedure to obtain Standard deviation using EXCEL software is as follows:

  • Open an EXCEL file.
  • Enter the data in the column K in cells K1 to K9.
  • In cell A1, enter the formula “=STDEV(K1:K9)”.
  • Output using EXCEL software is given below:

APPLIED STATISTICS IN BUSINESS AND ECO, Chapter 4, Problem 85CE , additional homework tip  6

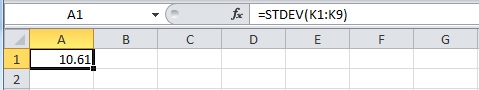
Thus, the Standard deviation for Week 3 is 10.61.

For Week 4:

Mean:

Software procedure:

Step-by-step software procedure to obtain Mean using EXCEL software is as follows:

  • Open an EXCEL file.
  • Enter the data in the column L in cells L1 to L9.
  • In cell A1, enter the formula “=AVERAGE(L1:L9)”.
  • Output using EXCEL software is given below:

APPLIED STATISTICS IN BUSINESS AND ECO, Chapter 4, Problem 85CE , additional homework tip  7

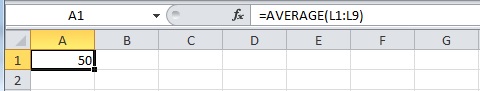
Thus, the mean for Week 4 is 50.

Standard deviation:

Software procedure:

Step-by-step software procedure to obtain standard deviation using EXCEL software is as follows:

  • Open an EXCEL file.
  • Enter the data in the column L in cells L1 to L9.
  • In cell A1, enter the formula “=STDEV(L1:L9)”.
  • Output using EXCEL software is given below:

APPLIED STATISTICS IN BUSINESS AND ECO, Chapter 4, Problem 85CE , additional homework tip  8

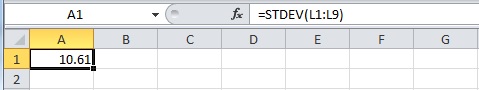
Thus, the Standard deviation for Week 4 is 10.61.

b.

To determine

Write the conclusion based on the measures of center and variability.

b.

Expert Solution
Check Mark

Explanation of Solution

By observing the values of mean and standard deviation, it states that the occupancy rate in the hotels is same for all the week ends during offseason. Therefore, it can be concluded that the distribution of the occupancy rate is normal.

c.

To determine

Calculate the median for the each week.

c.

Expert Solution
Check Mark

Answer to Problem 85CE

The Median for the occupancy rates is:

MeasuresWeek 1Week 2Week 3Week 4
Median50525647

Explanation of Solution

For Week 1:

Median:

Software procedure:

Step-by-step software procedure to obtain Median using EXCEL software is as follows:

  • Open an EXCEL file.
  • Enter the data in the column I in cells I1 to I9.
  • In cell A1, enter the formula “=MEDIAN(I1:19)”.
  • Output using EXCEL software is given below:

APPLIED STATISTICS IN BUSINESS AND ECO, Chapter 4, Problem 85CE , additional homework tip  9

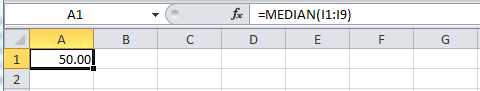
Thus, the median for Week 1 is 50.

For Week 2:

Median:

Software procedure:

Step-by-step software procedure to obtain Median using EXCEL software is as follows:

  • Open an EXCEL file.
  • Enter the data in the column J in cells J1 to J9.
  • In cell A1, enter the formula “=MEDIAN(J1:J9)”.
  • Output using EXCEL software is given below:

APPLIED STATISTICS IN BUSINESS AND ECO, Chapter 4, Problem 85CE , additional homework tip  10

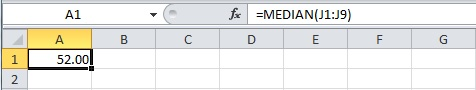
Thus, the median for Week 2 is 52.

For Week 3:

Median:

Software procedure:

Step-by-step software procedure to obtain Median using EXCEL software is as follows:

  • Open an EXCEL file.
  • Enter the data in the column K in cells K1 to K9.
  • In cell A1, enter the formula “=MEDIAN(K1:K9)”.
  • Output using EXCEL software is given below:

APPLIED STATISTICS IN BUSINESS AND ECO, Chapter 4, Problem 85CE , additional homework tip  11

Thus, the median for Week 3 is 56.

For Week 4:

Median:

Software procedure:

Step-by-step software procedure to obtain Median using EXCEL software is as follows:

  • Open an EXCEL file.
  • Enter the data in the column L in cells L1 to L9.
  • In cell A1, enter the formula “=MEDIAN(L1:L9)”.
  • Output using EXCEL software is given below:

APPLIED STATISTICS IN BUSINESS AND ECO, Chapter 4, Problem 85CE , additional homework tip  12

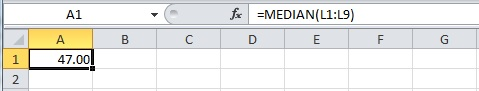
Thus, the median for Week 4 is 47.

d.

To determine

Construct dot plot for each sample.

d.

Expert Solution
Check Mark

Answer to Problem 85CE

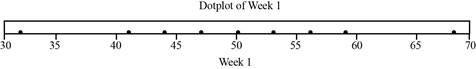
The dot plot for Week 1 is as follows:

APPLIED STATISTICS IN BUSINESS AND ECO, Chapter 4, Problem 85CE , additional homework tip  13

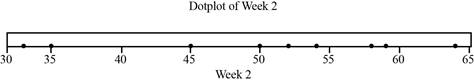
The dot plot for Week 2 is as follows:

APPLIED STATISTICS IN BUSINESS AND ECO, Chapter 4, Problem 85CE , additional homework tip  14

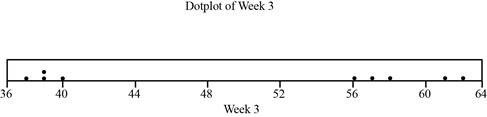
The dot plot for Week 3 is as follows:

APPLIED STATISTICS IN BUSINESS AND ECO, Chapter 4, Problem 85CE , additional homework tip  15

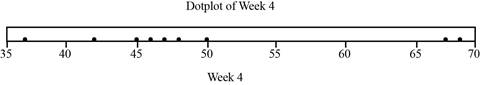
The dot plot for Week 4 is as follows:

APPLIED STATISTICS IN BUSINESS AND ECO, Chapter 4, Problem 85CE , additional homework tip  16

Explanation of Solution

Dot plot:

Procedure to draw a dot plot for Week 1:

  • Draw a horizontal line and mark the points from 30 to 70 with 5-point scale
  • For week 1, mark a point corresponding to each observation along the horizontal line.

Procedure to draw a dot plot for Week 2:

  • Draw a horizontal line and mark the points from 30 to 70 with 5-point scale
  • For week 2, mark a point corresponding to each observation along the horizontal line.

Procedure to draw a dot plot for Week 3:

  • Draw a horizontal line and mark the points from 36 to 64 with 4-point scale
  • For week 3, mark a point corresponding to each observation along the horizontal line.

Procedure to draw a dot plot for Week 4:

  • Draw a horizontal line and mark the points from 35 to 70 with 5-point scale
  • For week 4, mark a point corresponding to each observation along the horizontal line.

Thus, the dot plot has been obtained for Week 1, Week 2, Week 3 and Week 4.

e.

To determine

Describe the things that have been learnt from the median and dot plot, that was not apparent from the means and standard deviation.

e.

Expert Solution
Check Mark

Explanation of Solution

The distribution of the occupancy rate is normal based on the value of mean and standard deviation. However, the median value and dot plot states that the distribution of the occupancy rate is little bit different.

Want to see more full solutions like this?

Subscribe now to access step-by-step solutions to millions of textbook problems written by subject matter experts!

Chapter 4 Solutions

APPLIED STATISTICS IN BUSINESS AND ECO

Ch. 4.2 - Prob. 11SECh. 4.2 - Prob. 12SECh. 4.2 - (a) Write the Excel function for the 10 percent...Ch. 4.2 - Prob. 14SECh. 4.2 - Prob. 15SECh. 4.2 - Spirit Airlines kept track of the number of empty...Ch. 4.2 - CitiBank recorded the number of customers to use a...Ch. 4.2 - On Friday night, the owner of Chez Pierre in...Ch. 4.2 - Prob. 19SECh. 4.2 - Prob. 20SECh. 4.3 - (a) Find the mean and standard deviation for each...Ch. 4.3 - For each data set: (a) Find the mean. (b) Find the...Ch. 4.3 - In fuel economy tests in city driving conditions,...Ch. 4.3 - Over the past month, Bobs bowling score mean was...Ch. 4.3 - Prob. 25SECh. 4.3 - Prob. 26SECh. 4.3 - (a) Find the coefficient of variation for prices...Ch. 4.3 - Prob. 28SECh. 4.3 - Noodles and Company tested consumer reaction to...Ch. 4.4 - (a) By Chebyshevs Theorem, at least how many...Ch. 4.4 - An exam has a mean of 70 with a standard deviation...Ch. 4.4 - Prob. 32SECh. 4.4 - The mean collection period for accounts receivable...Ch. 4.4 - Prob. 34SECh. 4.4 - Prob. 35SECh. 4.4 - Prob. 36SECh. 4.4 - Find the original data value corresponding to each...Ch. 4.4 - CitiBank recorded the number of customers to use a...Ch. 4.4 - Prob. 39SECh. 4.5 - Scores on an accounting exam ranged from 42 to 96,...Ch. 4.5 - In 2007, total compensation (in thousands of...Ch. 4.5 - Waiting times (minutes) for a table at Joeys BBQ...Ch. 4.5 - Coffee temperatures (degrees Fahrenheit) at a...Ch. 4.5 - Prob. 44SECh. 4.5 - On San Martin Boulevard, embedded sensors kept...Ch. 4.5 - Prob. 46SECh. 4.5 - Prob. 47SECh. 4.6 - For each X-Y data set (n = 12): (a) Make a scatter...Ch. 4.6 - Your laptop gets warm (even hot) when you place it...Ch. 4.6 - Prob. 50SECh. 4.6 - Prob. 51SECh. 4.7 - Estimate the mean from this table of grouped data...Ch. 4.7 - Estimate the mean from the following table of...Ch. 4 - What are descriptive statistics? How do they...Ch. 4 - Explain each concept: (a) center, (b) variability,...Ch. 4 - Prob. 3CRCh. 4 - List strengths and weaknesses of each measure of...Ch. 4 - Prob. 5CRCh. 4 - (a) What is a bimodal distribution? (b) Explain...Ch. 4 - Prob. 7CRCh. 4 - Prob. 8CRCh. 4 - (a) Which standard deviation formula (population,...Ch. 4 - (a) To what kind of data does Chebyshevs Theorem...Ch. 4 - Prob. 11CRCh. 4 - Prob. 12CRCh. 4 - Prob. 13CRCh. 4 - Prob. 14CRCh. 4 - (a) Explain the method of medians for calculating...Ch. 4 - (a) What is a box plot? What does it tell us? (b)...Ch. 4 - Prob. 17CRCh. 4 - Prob. 18CRCh. 4 - Prob. 19CRCh. 4 - (a) What is kurtosis? (b) Sketch a platykurtic...Ch. 4 - Prob. 54CECh. 4 - If the mean asset turnover for retail firms is...Ch. 4 - Prob. 56CECh. 4 - During a rock concert, the noise level (in...Ch. 4 - Bags of jelly beans have a mean weight of 396 gm...Ch. 4 - Based on experience, the Ball Corporations...Ch. 4 - SAT scores for the entering class of 2010 at...Ch. 4 - Prob. 61CECh. 4 - The average time a Boulder High varsity lacrosse...Ch. 4 - Prob. 63CECh. 4 - Below are monthly rents paid by 30 students who...Ch. 4 - How many days in advance do travelers purchase...Ch. 4 - The durations (minutes) of 26 electric power...Ch. 4 - The U.S. Postal Service will ship a Priority Mail...Ch. 4 - Prob. 68CECh. 4 - Prob. 69CECh. 4 - Prob. 70CECh. 4 - Prob. 71CECh. 4 - A plumbing suppliers mean monthly demand for vinyl...Ch. 4 - Prob. 73CECh. 4 - Prob. 74CECh. 4 - Prob. 75CECh. 4 - Caffeine content in a 5-ounce cup of brewed coffee...Ch. 4 - Prob. 77CECh. 4 - Prob. 78CECh. 4 - Prob. 79CECh. 4 - Prob. 80CECh. 4 - Prob. 81CECh. 4 - The median waiting time for a liver transplant in...Ch. 4 - A small suburban community agreed to purchase...Ch. 4 - A companys contractual trigger point for a union...Ch. 4 - Prob. 85CECh. 4 - (a) Enter the Excel function...Ch. 4 - Note: In each of the following tables, the upper...Ch. 4 - Prob. 88CECh. 4 - The self-reported number of hours worked per week...Ch. 4 - How long does it take to fly from Denver to...Ch. 4 - (a) Make an Excel scatter plot of X = 1990 assault...Ch. 4 - (a) Make an Excel scatter plot of X = airspeed...Ch. 4 - Prob. 95CECh. 4 - Prob. 1ERQCh. 4 - Which is not an ethical obligation of a...Ch. 4 - Prob. 3ERQCh. 4 - Prob. 4ERQCh. 4 - Give the type of measurement (nominal, ordinal,...Ch. 4 - Prob. 6ERQCh. 4 - To choose a sample of 12 students from a...Ch. 4 - Which of the following is not a reason for...Ch. 4 - Which statement is correct? Why not the others? a....Ch. 4 - Prob. 10ERQCh. 4 - The management of a theme park obtained a random...Ch. 4 - Which one of the following is true? Why not the...Ch. 4 - Prob. 13ERQCh. 4 - Prob. 14ERQCh. 4 - Here are the ages of a random sample of 20 CEOs...Ch. 4 - Prob. 16ERQCh. 4 - Prob. 17ERQCh. 4 - Prob. 18ERQCh. 4 - Which is not a characteristic of using a log scale...
Knowledge Booster
Background pattern image
Statistics
Learn more about
Need a deep-dive on the concept behind this application? Look no further. Learn more about this topic, statistics and related others by exploring similar questions and additional content below.
Recommended textbooks for you
Text book image
Glencoe Algebra 1, Student Edition, 9780079039897...
Algebra
ISBN:9780079039897
Author:Carter
Publisher:McGraw Hill
The Shape of Data: Distributions: Crash Course Statistics #7; Author: CrashCourse;https://www.youtube.com/watch?v=bPFNxD3Yg6U;License: Standard YouTube License, CC-BY
Shape, Center, and Spread - Module 20.2 (Part 1); Author: Mrmathblog;https://www.youtube.com/watch?v=COaid7O_Gag;License: Standard YouTube License, CC-BY
Shape, Center and Spread; Author: Emily Murdock;https://www.youtube.com/watch?v=_YyW0DSCzpM;License: Standard Youtube License