
Concept explainers
Videos
The CMO survey collects and dissemination the opinions of the top marketers in order to predict the future of markets, track marketing excellence, and improve the value of marketing in firms and in society. Part of the survey is devoted to the topic of marketing analytics and the understanding of what factor prevent companies from using more marketing analytics. The following finding are based on response from 272 senior marketers within B2B firms and 114 senior marketers within B2B firms.
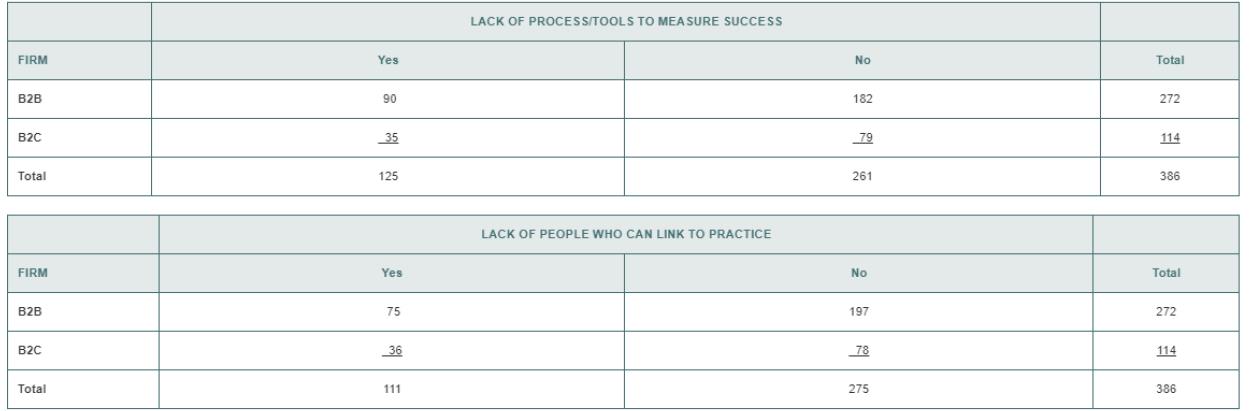
a. What is the probability that a randomly selected senior marketers indicates that lack of process/tools to measure success through analytics is a factor that prevents his/her company from using more marketing analytics?
b. Given that a random selected senior marketers is within a B2B firm, what is the probability that the senior marketers indicates that lacks of process/tools to measure success through analytics is a factor that prevents his/her company from using more marketing analytics?
c. Given that a random selected senior marketer is within a B2C firm, what is the probability that the senior marketers indicates that lacks of process/tools to measure success through analytics is a factor that prevents his/her company from using more marketing analytics?
d. What is the probability that a randomly selected senior marketers indicates that lack of people who can link to marketing practice is a factor that prevent his/her company from using more marketing analytics?
e. Given that a randomly selected senior marketer is within B2B firm, what is the probability that the senior marketing indicates that lack of the people who can link to marketing practice is a factor that prevents his/her company from using more marketing analytics?
f. Given that a randomly selected senior marketer is within B2C firm, what is the probability that the senior marketing indicates that lack of the people who can link to marketing practice is a factor that prevents his/her company from using more marketing analytics?
g. Comment on the results in (a) through (f).
Want to see the full answer?
Check out a sample textbook solution
Chapter 4 Solutions
BASIC BUSINESS STAT LL W/MYLAB


- The Consumer Reports Restaurant Customer Satisfaction Survey is based upon 148,599 visits to full-service restaurant chains. One of the variables in the study is meal price, the average amount paid per person for dinner and drinks, minus the tip. Suppose a reporter for the Sun Coast Times thought that it would be of interest to her readers to conduct a similar study for restaurants located on the Grand Strand section in Myrtle Beach, South Carolina. The reporter selected a sample of 8 seafood restaurants, 8 Italian restaurants, and 8 steakhouses. The data in Sheet 7 show the meal prices ($) obtained for the 24 restaurants sampled. Use alpha = 0.05 to test whether there is a significant difference among the mean meal price for the three types of restaurants. Sheet 7 Italian Seafood Steakhouse 12 16 24 13 18 19 15 17 23 17 26 25 18 23 21 20 15 22 17 19 27 24 18 31 Select one: a) Fstat = 7.33 > Fcrit = 3.47, insufficient evidence to reject the null…arrow_forwardExergamers are active videogames such as rhythmic dancing games, virtual bicycles, balance board simulators, and virtual simulators that require a screen and console. A study of exergaming practiced by students from grades 10 and 11 in Montreal, Canada, examined many factors related to participation in exergaming. Of 358 students who reported that they stressed about their health, 29.9% said that they were exergamers. Of the 851 students who reported that they did not stress about their health, 20.8% said they were exergamers. Use a signifigance test to compare the proportions. Write a short statement interpreting this result.arrow_forwardThe government sample survey of 60,000 households each month that produces data on employment, earnings, and many other variables is called the A. General Household Survey. B. Gallup Poll. C. Labor Statistics Survey. D. General Social Survey. E. Current Population Survey.arrow_forward
- The Behavioral Risk Factor Surveillance System (BRFSS) is an annual telephone survey designed to identify risk factors in the adult population and reportemerging health trends. The following table summarizes two variables for the respondents: health status and health coverage, which describes whether each respondent had health insurance: Health Status Excellent Very Good Good Fair Poor Total Health No 459 727 854 385 99 2524 Coverage Yes 4198 6245 4821 1634 578 17476 Total 4657 6972 5675 2019 677 20000 If we draw one individual at random, what is the probability that the respondent has health coverage if they have good health? Answer with a decimal rounded to 3 decimal places.arrow_forwardThe Consumer Reports Restaurant Customer Satisfaction Survey is based upon 148,599 visits to full-service restaurant chains (Consumer Reports website). One of the variables in the study is meal price, the average amount paid per person for dinner and drinks, minus the tip. Suppose a reporter for the Sun Coast Times thought that it would be of interest to her readers to conduct a similar study for restaurants located on the Grand Strand section in Myrtle Beach, South Carolina. The reporter selected a sample of 8 seafood restaurants, 8 Italian restaurants, and 8 steakhouses. The following data show the meal prices ($) obtained for the 24 restaurants sampled. Use a = 0.05 to test whether there is a significant difference among the mean meal price for the three types of restaurants. Please answer the questions in the image.arrow_forwardThe Consumer Reports Restaurant Customer Satisfaction Survey is based upon 148,599 visits to full-service restaurant chains (Consumer Reports website). One of the variables in the study is meal price, the average amount paid per person for dinner and drinks, minus the tip. Suppose the reporter for the Sun Coast Times thought that it would be of interest to her readers to conduct a similar study for restaurants located on the Grand Strand section in Myrtle Beach, South Carolina. The reporter selected a sample of 8 seafood restaurants, 8 Italian restaurants, and 8 steakhouses. The following data show the meal prices ($) obtained for the 24 restaurants sampled. Use a = .05 to test whether there is a significant difference among the mean meal price for the three types of restaurants. Italian Seafood Steakhouse $12 $16 $24 13 18 19 15 17 23 17 26 25 18 23 21 20 15 22 17 19 27 24 18 31arrow_forward
- The local government in Leeds is worried about the increasing amount of waste households in its city are producing. In order to gain a better understanding of what factors influence the amount of waste each household produces, consultants have gathered data from a random sample of 400 households on their average weekly waste, alongside information on the number of people living in the household, household income, whether anyone in the household works from home and whether the household has signed up to the ‘Make Leeds Greener’ initiative. The consultants have provided you with the following OLS output and asked you to provide a full discussion and interpretation of the statistical output. Where the dependent variable: Household average weekly waste (kgs) and the independent variables are: Household size - number of people living in the household; Household Income - salary in £000’s; Home work - someone working from home (1) ; no one working from home (0); Concern for Environment -…arrow_forwardCincinnati Paint Company sells quality brands of paints through hardware stores throughout the United States. The company maintains a large sales force who call on existing customers and look for new business. The national sales manager is investigating the relationship between the number of sales calls made and the miles driven by the sales representative. Also, do the sales representatives who drive the most miles and make the most calls necessarily earn the most in sales commissions? To investigate, the vice president of sales selected a sample of 25 sales representatives and determined: The amount earned in commissions last month (y) The number of miles driven last month (x1) The number of sales calls made last month (x2) The information is reported below. Commissions ($000) Calls Driven Commissions ($000) Calls Driven 23 68 2,372 39 188 3,291 14 30 2,229 44 218 3,103 34 136 2,733 29 105 2,123 39 180 3,353 38 162 2,794 24 77 2,291 37 154 3,209 47 186 3,451 15 25…arrow_forwardCincinnati Paint Company sells quality brands of paints through hardware stores throughout the United States. The company maintains a large sales force who call on existing customers and look for new business. The national sales manager is investigating the relationship between the number of sales calls made and the miles driven by the sales representative. Also, do the sales representatives who drive the most miles and make the most calls necessarily earn the most in sales commissions? To investigate, the vice president of sales selected a sample of 25 sales representatives and determined: The amount earned in commissions last month (y) The number of miles driven last month (x1) The number of sales calls made last month (x2) The information is reported below. Commissions ($000) Calls Driven Commissions ($000) Calls Driven 22 143 2,375 38 150 3,291 13 132 2,228 45 145 3,103 33 148 2,735 29 147 2,122 39 146 3,354 38 146 2,795 24 142 2,291 38 153 3,213 48 142 3,449…arrow_forward
- The National Assessment for Educational Progress (NAEP) is a U.S. government organization that assesses the performance of students and schools at all levels across the United States. The following table presents the percentage of eighth-grade students who were found to be proficient in mathematics and the percentage who were found to be proficient in reading in each of the ten most populous states. Use excels to find: State Percentage Proficient in Reading Percentage Proficient in Mathematics California 60 59 Texas 73 78 New York 75 70 Florida 66 68 Illinois 75 70 Pennsylvania 79 77 Ohio 79 76 Michigan 73 66 Georgia 67 64 North Carolina 71 73 Activities: Construct a scatterplot with reading proficiency on the horizontal axis and math proficiency on the vertical axis. Is there a linear relationship? Compute the correlation between reading proficiency and math proficiency. Is the linear…arrow_forwardA Pew Research study conducted in 2017 found that approximately 75% of Americans believe that robots and computers might one day do many of the jobs currently done by people.† Suppose we have the following data collected from nurses, tax auditors, and fast-food workers in which a higher score means the person feels his or her job is more likely to be automated. Nurse TaxAuditor Fast-FoodWorker 4 4 5 4 5 8 5 6 6 2 3 8 2 6 5 3 3 6 4 5 5 6 2 5 (a)Use ? = 0.05 to test for differences in the belief that a person's job is likely to be automated for the three professions. State the null and alternative hypotheses. 1. H0: μNurse = μTax auditor = μFast-food worker Ha: Not all the population means are equal. 2. H0: Not all the population means are equal. Ha: μNurse = μTax auditor = μFast-food worker 3. H0: At least two of the population means are equal. Ha: At least two of the population means are different. 4. H0: μNurse ≠ μTax auditor ≠ μFast-food worker…arrow_forward
 Glencoe Algebra 1, Student Edition, 9780079039897...AlgebraISBN:9780079039897Author:CarterPublisher:McGraw Hill