
Introductory Statistics
3rd Edition
ISBN: 9780135188927
Author: Gould, Robert, Ryan, Colleen N. (colleen Nooter)
Publisher: Pearson,
expand_more
expand_more
format_list_bulleted
Concept explainers
Videos
Textbook Question
Chapter 4, Problem 81CRE
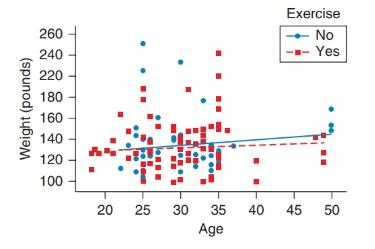
Age and Weight The following
Expert Solution & Answer
Want to see the full answer?
Check out a sample textbook solution
Students have asked these similar questions
The boxplot below shows salaries for Construction workers and Teachers.
If a person is making the maximum salary for a construction worker, they are making more than what percentage of Teachers?They are making more than % of Teachers.
The boxplot below shows salaries for Construction workers and Teachers.If a person is making the median salary for a construction worker, they are making more than what percentage of Teachers?They are making more than % of Teachers.
Show your work
Identify the means and the extremes.
Chapter 4 Solutions
Introductory Statistics
Ch. 4 - GPA Predictors The scatterplots show SAT scores...Ch. 4 - Salary and Employment The first graph shows the...Ch. 4 - Age and Credits The scatterplot below shows data...Ch. 4 - Age and GPA The scatterplot shows data on age and...Ch. 4 - Credits and GPA (Example 1) The scatterplot shows...Ch. 4 - Salary and Education The scatterplot shows data on...Ch. 4 - Sisters and Brothers The scatterplot shows the...Ch. 4 - House Price and Area Describe the trend in the...Ch. 4 - Work and TV The scatterplot shows the number of...Ch. 4 - Work and Sleep The scatterplot shows the number of...
Ch. 4 - Age and Sleep The scatterplot shows the age and...Ch. 4 - Height and Weight for Women The figure shows a...Ch. 4 - College Tuition and ACT a. The first scatterplot...Ch. 4 - Ages of Women Who Give Birth The figure shows a...Ch. 4 - Law School The scatterplot shows the LSAT (Law...Ch. 4 - Medical School The scatterplot shows the...Ch. 4 - Matching Pick the letter of the graph that goes...Ch. 4 - Matching Pick the letter of the graph that goes...Ch. 4 - Matching Match each of the following correlations...Ch. 4 - Matching Match each of the following correlations...Ch. 4 - Airline Tickets (Example 2) The distance (in...Ch. 4 - Train Tickets The table for part (a) shows...Ch. 4 - SAT and GPA In Exercise 4.1 there is a graph of...Ch. 4 - House Price The correlation between house price...Ch. 4 - Rate My Professor Seth Wagerman, a former...Ch. 4 - Cousins Five people were asked how many female...Ch. 4 - GPA and Gym Use USA Today College published an...Ch. 4 - Education and Life Expectancy United Press...Ch. 4 - Salaries of College Graduates (Example 3) The...Ch. 4 - Mother and Daughter Heights The graph shows the...Ch. 4 - Median Weekly Earning by Gender The scatterplot...Ch. 4 - Home Prices and Size The scatterplot shows the...Ch. 4 - Height and Arm Span for Women (Example 4) TI-84...Ch. 4 - Hand and Foot Length for Women The computer output...Ch. 4 - Height and Arm Span for Men (Example 5)...Ch. 4 - Hand Length and Foot Length for Men Measurements...Ch. 4 - Comparing Correlation for Arm Span and Height The...Ch. 4 - Age and Weight for Men and Women The scatterplot...Ch. 4 - Singles and Doubles Winning Percentage The...Ch. 4 - Seesaw The figure shows a scatterplot of the...Ch. 4 - Choosing the Predictor and Response Variables...Ch. 4 - Choosing the Predictor and the Response Variable...Ch. 4 - Percentage of Smoke-Free Homes and Percentage of...Ch. 4 - Effect of Adult Smoking on High School Student...Ch. 4 - Car Insurance and Age The following graph shows...Ch. 4 - Life Insurance and Age The graph shows the monthly...Ch. 4 - How Is the Time of a Flight Related to the...Ch. 4 - Distance and Train Ticket Price The following...Ch. 4 - Do States with Higher Populations Have More...Ch. 4 - Movie Ratings The following table give the Rotten...Ch. 4 - Pitchers The table shows the Earned Run Average...Ch. 4 - Text Messages The following table shows the number...Ch. 4 - Answer the questions using complete sentences. a....Ch. 4 - Answer the questions using complete sentences. a....Ch. 4 - If there is a positive correlation between number...Ch. 4 - Suppose that the growth rate of children looks...Ch. 4 - Coefficient of Determination If the correlation...Ch. 4 - Coefficient of Determination Does a correlation of...Ch. 4 - Investing Some investors use a technique called...Ch. 4 - Blood Pressure Suppose a doctor telephones those...Ch. 4 - Salary and Year of Employment (Example 8) The...Ch. 4 - MPG: Highway and City The following figure shows...Ch. 4 - Cost of Turkeys The following table shows the...Ch. 4 - Wine Calories The table shows the calories in a...Ch. 4 - Teacher Pay and Expenditure Per Student (Example...Ch. 4 - Teacher Pay and High School Graduation Rates The...Ch. 4 - Does Having a Job Affect Students’ Grades?...Ch. 4 - Weight of Trash and Household Size Data were...Ch. 4 - Predicting Home Runs Data on the number of home...Ch. 4 - Predicting 3-Point Baskets Data on the 3-point...Ch. 4 - 4th-Grade Reading and Math Scores Data from the...Ch. 4 - SAT Scores The following table shows the average...Ch. 4 - Test Scores Assume that in a political science...Ch. 4 - Test Scores Assume that in a sociology class, the...Ch. 4 - Heights and Weights of People The following table...Ch. 4 - Heights and Weights of Men The table shows the...Ch. 4 - Prob. 77CRECh. 4 - Granola Bars The following table shows the fat...Ch. 4 - Shoe Size and Height The scatterplot shows the...Ch. 4 - Age and Sleep The following scatterplot shows the...Ch. 4 - Age and Weight The following scatterplot shows the...Ch. 4 - Heights and Test Scores a. The following figure...Ch. 4 - Law School Selectivity and Employment The...Ch. 4 - Prob. 84CRECh. 4 - Prob. 87CRECh. 4 - Fuel-Efficient Cars The following table gives the...Ch. 4 - Tall Buildings The following scatterplot shows...Ch. 4 - For 4.91 through 4.94 show your points in a rough...Ch. 4 - For 4.91 through 4.94 show your points in a rough...Ch. 4 - For 4.91 through 4.94 show your points in a rough...Ch. 4 - For 4.91 through 4.94 show your points in a rough...Ch. 4 - The following figure shows a scatterplot of the...Ch. 4 - Wages and Education The figure shows a scatterplot...Ch. 4 - Do Students Taking More Units Study More Hours?...Ch. 4 - Hours of Exercise and Hours of Homework The...Ch. 4 - Children’s Ages and Heights The following figure...Ch. 4 - Blackjack Tips The following figure shows the...Ch. 4 - Decrease in Cholesterol A doctor is studying...Ch. 4 - Prob. 102CRE
Additional Math Textbook Solutions
Find more solutions based on key concepts
the type of variable is the response.
Stats: Modeling the World Nasta Edition Grades 9-12
31. Putting It Together: A Tornado Model Is the width of a tornado related to the amount of distance for which ...
Statistics: Informed Decisions Using Data (5th Edition)
Medication Usage In a survey of 3005 adults aged 57 through 85 years, it was found that 82% of them used at lea...
Statistical Reasoning for Everyday Life (5th Edition)
Find how many SDs above the mean price would be predicted to cost.
Intro Stats, Books a la Carte Edition (5th Edition)
AVX Home Entertainment, Inc., recently began a “no-hassles” return policy. A sample of 500 customers who recent...
EBK STATISTICAL TECHNIQUES IN BUSINESS
Testing Hypotheses. In Exercises 13-24, assume that a simple random sample has been selected and test the given...
Elementary Statistics Using the TI-83/84 Plus Calculator, Books a la Carte Edition (4th Edition)
Knowledge Booster


Learn more about
Need a deep-dive on the concept behind this application? Look no further. Learn more about this topic, statistics and related others by exploring similar questions and additional content below.Similar questions
- The speed, in miles per hour, of Mario's serves during tennis practice is shown in the stem-and-leaf plot below. a. What is the range of the speeds, in miles per hour, of Mario's tennis serves? Show or explain how you got your answer. b.What is the mode of the speeds, in miles per hour, of Mario's tennis serves? Show or explain how you got your answer. c.What is the median speed, in miles per hour, of Mario's tennis serves? Show or explain how you got your answer. d. The speed of one additional tennis serve will be added to Mario's stem-and-leaf plot. What is the greatest amount, in miles per hour, the median speed can change? Show or explain how you got your answer.arrow_forwardMackenzie makes the minimum salary for an Actuary. Stacy makes the median salary for a CPA.arrow_forwardThe speed, in miles per hour, of Mario's serves during tennis practice is shown in the stem-and-leaf plot below. The speed of one additional tennis serve will be added to Mario's stem-and-leaf plot. What is the greatest amount, in miles per hour, the median speed can change? Show or explain how you got your answer.arrow_forward
- The World’s Highest Waterfalls: The Information Please Almanac lists the world’s highest waterfalls. The list shows that Angel Falls in Venezuela is 3281 feet high, or more than twice as high as Ribbon Falls in Yosemite, California, which is 1612 feet high. What kind of data are these heights?arrow_forwardThe boxplot below shows salaries for CPAs and Actuaries in a town.If a person is making the minimum salary for a CPA, they are making less than _______ % of Actuaries. Show your workarrow_forwardYour friend brags about his ability to do pull-ups. To demonstrate his skills, he has calculated the average number of pull-ups he can do. He wants to know if this significantly exceed the average pull-ups men in the United States can do. The average pull-ups for men in the United States is 8 reps. A). z-test or t-test, and why? B). What are the H1 and H0?arrow_forward
- how do you find the end behaviors ? our teacher says it's easier to use the chartarrow_forwardThe brand manager for a brand of toothpaste must plan a campaign designed to increase brand recognition. He wants to first determine the percentage of adults who have heard of the brand. How many adults must he survey in order to be 80% confident that his estimate is within seven percentage points of the true population percentage? Complete parts (a) through (c) below. The brand manager for a brand of toothpaste must plan a campaign designed to increase brand recognition. He wants to first determine the percentage of adults who have heard of the brand. How many adults must he survey in order to be 80% confident that his estimate is within six percentage points of the true population percentage? Complete parts (a) through (c) below. 1) Assume that nothing is known about the percentage of adults who have heard of the brand.a.n=_________(Round up to the nearest integer.) 2) Assume that a recent survey suggests that about 85% of adults have heard of the brand. b.n=_________(Round…arrow_forwardA. The median would be greater than the mean B. The mean would be greater than the median C. The mean and the median would be equalarrow_forward
- See picture to answer C and D (c)Which athlete had a greater median distance? Choose one (Athlete A/ Athlete B/ Both had the same median) (d)Which athlete had a smaller range of distances? Choose one (Athlete A/ Athlete B/ Both had the same rangearrow_forwardThe prices in the table above show the different types of gas offered at a gas station and the prices of the gas per gallon . If Emily has $ 50, what is the least amount of gas, in gallons, she can purchase subtracted from the greatest amount of gas , in gallons she can purchase ? (A)3 gallons ( B ) 5 gallons (C ) 20 gallons (D ) 25 gallonsarrow_forwardAn investor bought common stock of Blackstone Company on several occasions at the following prices. Number of Shares Price per Share 100 $ 33 200 $ 33 400 $ 25 The average price per share at which the investor bought these shares of common stock was the closest to _____.arrow_forward
arrow_back_ios
SEE MORE QUESTIONS
arrow_forward_ios
Recommended textbooks for you
 Elementary AlgebraAlgebraISBN:9780998625713Author:Lynn Marecek, MaryAnne Anthony-SmithPublisher:OpenStax - Rice University
 Holt Mcdougal Larson Pre-algebra: Student Edition...AlgebraISBN:9780547587776Author:HOLT MCDOUGALPublisher:HOLT MCDOUGAL
 Big Ideas Math A Bridge To Success Algebra 1: Stu...AlgebraISBN:9781680331141Author:HOUGHTON MIFFLIN HARCOURTPublisher:Houghton Mifflin Harcourt
Elementary Algebra
Algebra
ISBN:9780998625713
Author:Lynn Marecek, MaryAnne Anthony-Smith
Publisher:OpenStax - Rice University
Holt Mcdougal Larson Pre-algebra: Student Edition...
Algebra
ISBN:9780547587776
Author:HOLT MCDOUGAL
Publisher:HOLT MCDOUGAL
Big Ideas Math A Bridge To Success Algebra 1: Stu...
Algebra
ISBN:9781680331141
Author:HOUGHTON MIFFLIN HARCOURT
Publisher:Houghton Mifflin Harcourt
Statistics 4.1 Introduction to Inferential Statistics; Author: Dr. Jack L. Jackson II;https://www.youtube.com/watch?v=QLo4TEvBvK4;License: Standard YouTube License, CC-BY