
Concept explainers
Videos
Tall Buildings The following
a. What does the trend tell us about the relationship between stories and height (feet)?
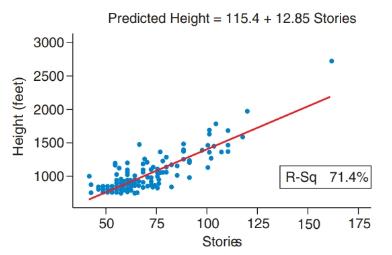
b. The regression line for predicting the height (in feet) from the number of stories is shown above the graph. What height would you predict for a building with 100 stories?
c. Interpret the slope.
d. What, if anything, do we learn from the intercept?
e. Interpret the coefficient of determination. (This data set is available at this text’s website, and it contains several other variables. You might want to check to see whether the year the building was constructed is related to its height, for example.)
Want to see the full answer?
Check out a sample textbook solution
Chapter 4 Solutions
Introductory Statistics
Additional Math Textbook Solutions
Business Analytics
Basic Business Statistics, Student Value Edition
APPLIED STAT.IN BUS.+ECONOMICS
Elementary Statistics ( 3rd International Edition ) Isbn:9781260092561
Probability and Statistics for Engineering and the Sciences
Elementary Statistics (13th Edition)


- Neurology The average weight of a male child’s brain is 970 grams at age 1 and 1270 grams at age 3. (a) Assuming that the relationship between brain weight y and age t is linear, write a linear model for the data. (b) What is the slope and what does it tell you about brain weight? (c) Use your model to estimate the average brain weight at age 2. (d) Use your school’s library, the Internet, or some other reference source to find the actual average brain weight at age 2. How close was your estimate? (e) (d) Do you think your model could be used to determine the average brain weight of an adult? Explain.arrow_forwardDemand for Candy Bars In this problem you will determine a linear demand equation that describes the demand for candy bars in your class. Survey your classmates to determine what price they would be willing to pay for a candy bar. Your survey form might look like the sample to the left. a Make a table of the number of respondents who answered yes at each price level. b Make a scatter plot of your data. c Find and graph the regression line y=mp+b, which gives the number of respondents y who would buy a candy bar if the price were p cents. This is the demand equation. Why is the slope m negative? d What is the p-intercept of the demand equation? What does this intercept tell you about pricing candy bars? Would you buy a candy bar from the vending machine in the hallway if the price is as indicated. Price Yes or No 50 75 1.00 1.25 1.50 1.75 2.00arrow_forwardLife Expectancy The following table shows the average life expectancy, in years, of a child born in the given year42 Life expectancy 2005 77.6 2007 78.1 2009 78.5 2011 78.7 2013 78.8 a. Find the equation of the regression line, and explain the meaning of its slope. b. Plot the data points and the regression line. c. Explain in practical terms the meaning of the slope of the regression line. d. Based on the trend of the regression line, what do you predict as the life expectancy of a child born in 2019? e. Based on the trend of the regression line, what do you predict as the life expectancy of a child born in 1580?2300arrow_forward
 Trigonometry (MindTap Course List)TrigonometryISBN:9781337278461Author:Ron LarsonPublisher:Cengage Learning
 Glencoe Algebra 1, Student Edition, 9780079039897...AlgebraISBN:9780079039897Author:CarterPublisher:McGraw Hill
 Functions and Change: A Modeling Approach to Coll...AlgebraISBN:9781337111348Author:Bruce Crauder, Benny Evans, Alan NoellPublisher:Cengage Learning
 Big Ideas Math A Bridge To Success Algebra 1: Stu...AlgebraISBN:9781680331141Author:HOUGHTON MIFFLIN HARCOURTPublisher:Houghton Mifflin Harcourt
 Holt Mcdougal Larson Pre-algebra: Student Edition...AlgebraISBN:9780547587776Author:HOLT MCDOUGALPublisher:HOLT MCDOUGAL
 Intermediate AlgebraAlgebraISBN:9781285195728Author:Jerome E. Kaufmann, Karen L. SchwittersPublisher:Cengage Learning