
Concept explainers
Videos
Use a calculator with an
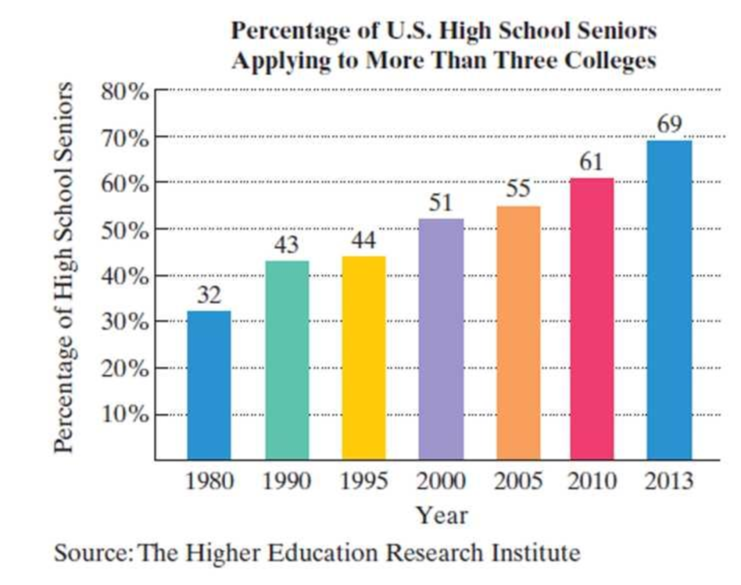
The bar graph shows the percentage of U.S. high school seniors who applied to more than three colleges for selected years from 1980 through 2013.
The data can be modeled by
in which f(x) and g(x) represent the percentage of high school seniors who applied to more than three colleges x years after 1980. Use these functions to solve Exercises 71–72. Where necessary, round answers to the nearest percent.
72. a. According to the linear model, what percentage of high school seniors applied to more than three colleges in 2010?
b. According to the exponential model, what percentage of high school seniors applied to more than three colleges in 2010?
c. Which function is a better model for the data shown by the bar graph in 2010?
Want to see the full answer?
Check out a sample textbook solution
Chapter 4 Solutions
College Algebra Essentials, Books a la Carte Edition (5th Edition)


- The population of the United States is predicted to be P(t) = 310e0.0073t million, where t is the number of years after the year 2010.† Predict the average population between the years 2010 and 2040.arrow_forwardAs baby boomers enter their golden years, the number of people afflicted with Alzheimer's disease is expected to rise dramatically. In a study published in the Journal of Neurology, the number of people with Alzheimer's disease in the United States age 65 years and over is projected to be N(t) = 0.00525t2 + 0.075t + 4.7 (0 ≤ t ≤ 4) million in decade t, where t = 0 corresponds to 2010.† (a)What is the projected number of people with Alzheimer's disease in the United States age 65 years and over in 2040? (Round your answer to four decimal places.) million (b) How fast is the number of people with Alzheimer's disease in the United States age 65 years and over projected to grow in 2040? million per decade (c)How fast is the rate of growth of people with Alzheimer's disease in the United States age 65 years and over projected to change in the period covered by the study? million per decade per decadearrow_forwardIn Exercises 13–24, draw a dependency diagram and write a Chain Rule formula for each derivative.arrow_forward
 Algebra & Trigonometry with Analytic GeometryAlgebraISBN:9781133382119Author:SwokowskiPublisher:Cengage