
Concept explainers
Videos
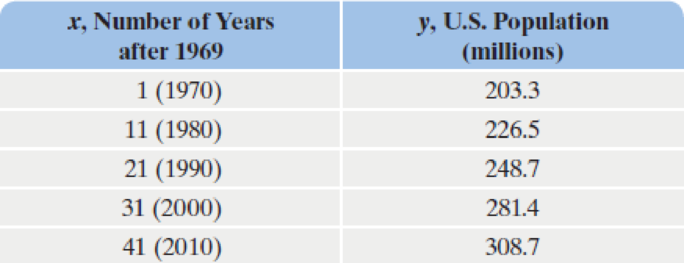
In Example 1 on page 520, we used two data points and an exponential function to model the population of the United States from 1970 through 2010. The data are shown again in the table. Use all five data points to solve Exercises 66–70.
66.
- a. Use your graphing utility’s exponential regression option to obtain a model of the form y = abx that fits the data. How well does the
correlation coefficient , r, indicate that the model fits the data? - b. Rewrite the model in terms of base e. By what percentage is the population of the United States increasing each year?
67. Use your graphing utility’s logarithmic regression option to obtain a model of the form y = a + b ln x that fits the data. How well does the correlation coefficient, r, indicate that the model fits the data?
68. Use your graphing utility’s linear regression option to obtain a model of the form y = ax + b that fits the data. How well does the correlation coefficient, r, indicate that the model fits the data?
69. Use your graphing utility’s power regression option to obtain a model of the form y = axb that fits the data. How well does the correlation coefficient, r, indicate that the model fits the data?
70. Use the values of r in Exercises 66–69 to select the two models of best fit. Use each of these models to predict by which year the U.S. population will reach 335 million. How do these answers compare to the year we found in Example 1, namely 2020? If you obtained different years, how do you account for this difference?
Want to see the full answer?
Check out a sample textbook solution
Chapter 4 Solutions
College Algebra Essentials, Books a la Carte Edition (5th Edition)


- What situations are best modeled by a logistic equation? Give an example, and state a case for why the example is a good fit.arrow_forwardCable TV The following table shows the number C. in millions, of basic subscribers to cable TV in the indicated year These data are from the Statistical Abstract of the United States. Year 1975 1980 1985 1990 1995 2000 C 9.8 17.5 35.4 50.5 60.6 60.6 a. Use regression to find a logistic model for these data. b. By what annual percentage would you expect the number of cable subscribers to grow in the absence of limiting factors? c. The estimated number of subscribers in 2005 was 65.3million. What light does this shed on the model you found in part a?arrow_forwardWorld Population The following table shows world population N, in billions, in the given year. Year 1950 1960 1970 1980 1990 2000 2010 N 2.56 3.04 3.71 4.45 5.29 6.09 6.85 a. Use regression to find a logistic model for world population. b. What r value do these data yield for humans on planet Earth? c. According to the logistic model using these data, what is the carrying capacity of planet Earth for humans? d. According to this model, when will world population reach 90 of carrying capacity? Round to the nearest year. Note: This represents a rather naive analysis of world population.arrow_forward
- Find an exponential function of the form y=ab^x that passes through the points (0,4) and (2,100)arrow_forwardChapter 2, Section 1, Exercise 001 This exercise provides information about data in a survey of students.The survey students consisted of 157 females and 160 males.Find p^, the proportion who are female.Round your answer to three decimal places.p^=Enter your answer in accordance to the question statementarrow_forwardAn arborist creates a table of different tree height patterns over a 4 year period. Time Fig Palm Maple 0 8 7 5 1 14 9.8 6 2 20 13.7 10.2 3 26 19.2 17.3 Which of the trees has an exponential growth pattern? Which of the following statements are true? Select all that apply.A. For exponential models, the difference between consecutive entries in the table is a constant.B. For exponential models, the relative change from one time to the next is always a constant.C. For exponential models, the absolute change from one time to the next is always a constant.D. For exponential models, the ratio of consecutive entries in the table is a constant.E. None of the above statements is true.arrow_forward
 Functions and Change: A Modeling Approach to Coll...AlgebraISBN:9781337111348Author:Bruce Crauder, Benny Evans, Alan NoellPublisher:Cengage Learning
 Algebra & Trigonometry with Analytic GeometryAlgebraISBN:9781133382119Author:SwokowskiPublisher:Cengage
 Algebra: Structure And Method, Book 1AlgebraISBN:9780395977224Author:Richard G. Brown, Mary P. Dolciani, Robert H. Sorgenfrey, William L. ColePublisher:McDougal Littell