In Exercises 9-20, use the data in the following table, which lists drive-thru order accuracy at popular fast food chains (data from a QSR Drive-Thru Study). Assume that orders are randomly selected from those included in the table. 12. Fast Food Drive-Thru Accuracy If one order is selected, find the probability of getting an order that is not accurate or is from Wendy’s. Are the events of selecting an order that is not accurate and selecting an order from Wendy’s disjoint events?
In Exercises 9-20, use the data in the following table, which lists drive-thru order accuracy at popular fast food chains (data from a QSR Drive-Thru Study). Assume that orders are randomly selected from those included in the table. 12. Fast Food Drive-Thru Accuracy If one order is selected, find the probability of getting an order that is not accurate or is from Wendy’s. Are the events of selecting an order that is not accurate and selecting an order from Wendy’s disjoint events?
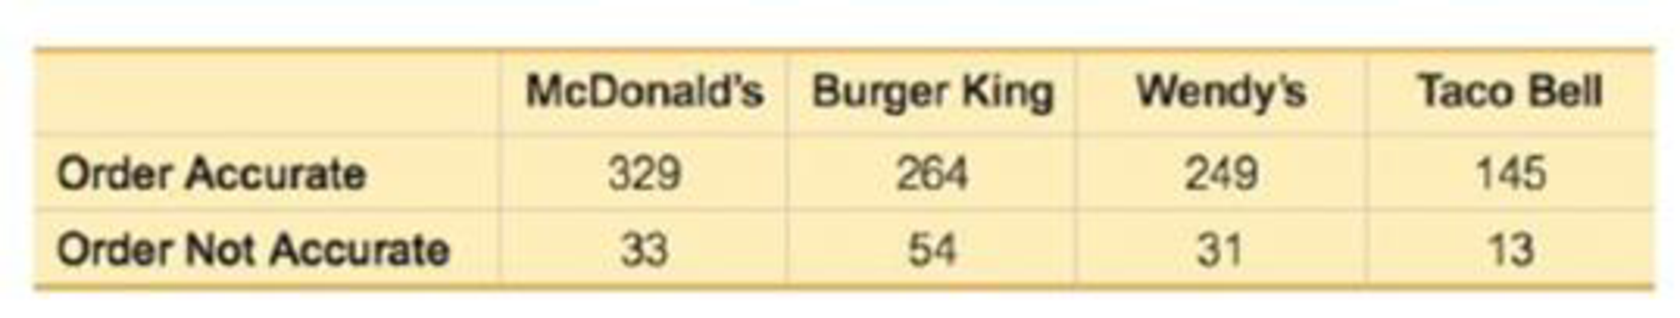
In Exercises 9-20, use the data in the following table, which lists drive-thru order accuracy at popular fast food chains (data from a QSR Drive-Thru Study). Assume that orders are randomly selected from those included in the table.
12. Fast Food Drive-Thru Accuracy If one order is selected, find the probability of getting an order that is not accurate or is from Wendy’s. Are the events of selecting an order that is not accurate and selecting an order from Wendy’s disjoint events?
Need a deep-dive on the concept behind this application? Look no further. Learn more about this topic, statistics and related others by exploring similar questions and additional content below.
Correlation Vs Regression: Difference Between them with definition & Comparison Chart; Author: Key Differences;https://www.youtube.com/watch?v=Ou2QGSJVd0U;License: Standard YouTube License, CC-BY
Correlation and Regression: Concepts with Illustrative examples; Author: LEARN & APPLY : Lean and Six Sigma;https://www.youtube.com/watch?v=xTpHD5WLuoA;License: Standard YouTube License, CC-BY


 Glencoe Algebra 1, Student Edition, 9780079039897...AlgebraISBN:9780079039897Author:CarterPublisher:McGraw Hill
 Holt Mcdougal Larson Pre-algebra: Student Edition...AlgebraISBN:9780547587776Author:HOLT MCDOUGALPublisher:HOLT MCDOUGAL
 College Algebra (MindTap Course List)AlgebraISBN:9781305652231Author:R. David Gustafson, Jeff HughesPublisher:Cengage Learning