
Concept explainers
Videos
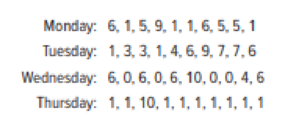
Spirit Airlines kept track of the number of empty seats on flight 308 (DEN-DTW) for 10 consecutive trips on each weekday except Friday. (a) Sort the data for each day. (b) Find the
a.
Arrange the data.
Answer to Problem 16SE
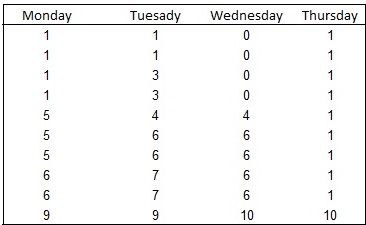
The sorted data is:
Explanation of Solution
Calculation:
The dataset represents the number of empty seats on flight 308 for 10 consecutive trips.
The data set of empty seats can be sorted either ascending or descending.
Here, the data is sorted in the ascending order.
Sorting:
Software procedure:
Step-by-step procedure to sort the data in ascending using the EXCEL is given below:
- Open an EXCEL file.
- Enter the data in the column in H cells H1 to H10, column in I cells I1 to I10, J cells J1 to J10 and column in K cells K1 to K10.
- Choose Data > Sort.
- In Column drop down box, select Column H.
- In Sort on drop down box, select Values.
- In Order drop down box, select “Smallest to Largest”.
- Click OK.
- In Column drop down box, select Column I.
- In Sort on drop down box, select Values.
- In Order drop down box, select “Smallest to Largest”.
- Click OK.
- In Column drop down box, select Column J.
- In Sort on drop down box, select Values.
- In Order drop down box, select “Smallest to Largest”.
- Click OK.
- In Column drop down box, select Column K.
- In Sort on drop down box, select Values.
- In Order drop down box, select “Smallest to Largest”.
- Click OK.
Thus, the sorted data has been stored in the column in H cells H1 to H10, column in I cells I1 to I10, J cells J1 to J10 and column in K cells K1 to K10.
b.
Find the Mean, Median, Mode, Midrange, Geometric mean, and 10% Trimmed mean.
Answer to Problem 16SE
The Mean, Median, Mode, Midrange, Geometric mean, and 10% Trimmed mean is:
| Descriptive measures | Monday | Tuesday | Wednesday | Thursday |
| Mean | 4 | 4.70 | 3.80 | 1.90 |
| Median | 5 | 5 | 5 | 1 |
| Mode | 1 | 1 | 6 | 1 |
| Geometric mean | 2.89 | 3.76 | Not applicable | 1.26 |
| Midrange | 5 | 5 | 5 | 5.50 |
| Trimmed mean | 3.75 | 4.63 | 3.50 | 1 |
Explanation of Solution
Calculation:
For Monday:
Mean:
Software procedure:
Step-by-step software procedure to obtain Mean using EXCEL software is as follows:
- Open an EXCEL file.
- Enter the data in the column I in cells I1 to I10.
- In cell A1, enter the formula “=AVERAGE(I1:I10)”.
- Output using EXCEL software is given below:
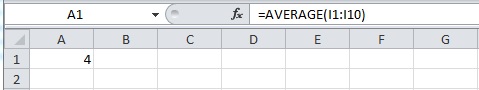
Thus, the mean number of empty seats on Monday is 4.
Median:
Software procedure:
Step-by-step software procedure to obtain Median using EXCEL software is as follows:
- Open an EXCEL file.
- Enter the data in the column I in cells I1 to I10.
- In cell A1, enter the formula “=MEDIAN(I1:110)”.
- Output using EXCEL software is given below:
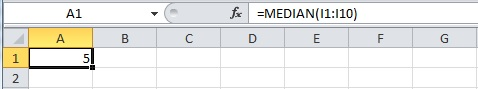
Thus, the median for the number of empty seats on Monday is 5.
Mode:
Software procedure:
Step-by-step software procedure to obtain Mode using EXCEL software is as follows:
- Open an EXCEL file.
- Enter the data in the column I in cells I1 to I10.
- In cell A1, enter the formula “=MODE.SNGL(I1:I10)”.
- Output using EXCEL software is given below:
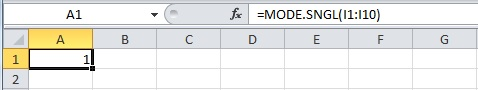
Thus, the mode for the number of empty seats on Monday is 1.
Geometric mean:
Software procedure:
Step-by-step software procedure to obtain Geometric mean using EXCEL software is as follows:
- Open an EXCEL file.
- Enter the data in the column I in cells I1 to I10.
- In cell A1, enter the formula “=GEOMEAN(I1:I10)”.
- Output using EXCEL software is given below:
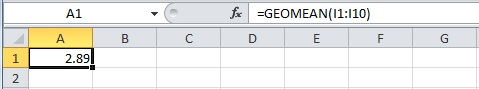
Thus, the geometric mean for the number of empty seats on Monday is 2.89.
Midrange:
Software procedure:
Step-by-step software procedure to obtain Midrange using EXCEL software is as follows:
- Open an EXCEL file.
- Enter the data in the column I in cells I1 to I10.
- In cell A1, enter the formula “=(MIN(I1:I10)+MAX(I1:I10))/2”.
- Output using EXCEL software is given below:
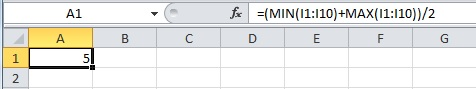
- Thus, the midrange for the number of empty seats on Monday is 5.
10% Trimmed mean:
Software procedure:
Step-by-step software procedure to obtain 10% Trimmed mean using EXCEL software is as follows:
- Open an EXCEL file.
- Enter the data in the column I in cells I1 to I10.
- In cell A1, enter the formula “=TRIMMEAN(I1:I10,0.2)”.
- Output using EXCEL software is given below:
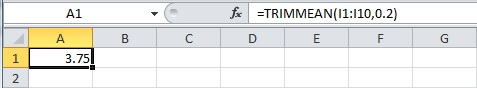
- Thus, the 10% Trimmed mean for the number of empty seats on Monday is 3.75.
For Tuesday:
Mean:
Software procedure:
Step-by-step software procedure to obtain Mean using EXCEL software is as follows:
- Open an EXCEL file.
- Enter the data in the column J in cells J1 to J10.
- In cell A1, enter the formula “=AVERAGE(J1:J10)”.
- Output using EXCEL software is given below:
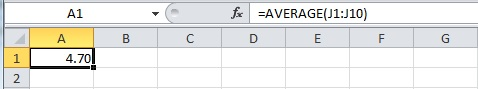
Thus, the mean number of empty seats on Tuesday is 4.70.
Median:
Software procedure:
Step-by-step software procedure to obtain Median using EXCEL software is as follows:
- Open an EXCEL file.
- Enter the data in the column J in cells J1 to J10.
- In cell A1, enter the formula “=MEDIAN(J1:J10)”.
- Output using EXCEL software is given below:
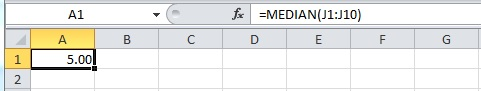
Thus, the median for the number of empty seats on Tuesday is 5.
Mode:
Software procedure:
Step-by-step software procedure to obtain Mode using EXCEL software is as follows:
- Open an EXCEL file.
- Enter the data in the column J in cells J1 to J10.
- In cell A1, enter the formula “=MODE.SNGL(J1:J10)”.
- Output using EXCEL software is given below:
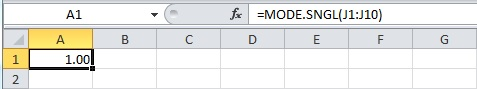
Thus, the mode for the number of empty seat on Tuesday is 1.
Geometric mean:
Software procedure:
Step-by-step software procedure to obtain Geometric mean using EXCEL software is as follows:
- Open an EXCEL file.
- Enter the data in the column J in cells J1 to J10.
- In cell A1, enter the formula “=GEOMEAN(J1:J10)”.
- Output using EXCEL software is given below:
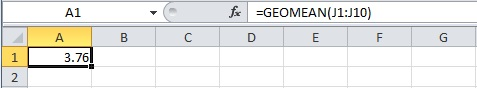
Thus, the geometric mean for the number of empty seats on Tuesday is 3.76.
Midrange:
Software procedure:
Step-by-step software procedure to obtain Midrange using EXCEL software is as follows:
- Open an EXCEL file.
- Enter the data in the column J in cells J1 to J10.
- In cell A1, enter the formula “=(MIN(J1:J10)+MAX(J1:J10))/2”.
- Output using EXCEL software is given below:
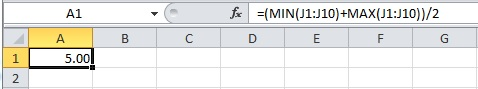
- Thus, the midrange for the number of empty seats on Tuesday is 5.
10% Trimmed mean:
Software procedure:
Step-by-step software procedure to obtain 10% Trimmed mean using EXCEL software is as follows:
- Open an EXCEL file.
- Enter the data in the column J in cells J1 to J10.
- In cell A1, enter the formula “=TRIMMEAN(J1:J10,0.2)”.
- Output using EXCEL software is given below:
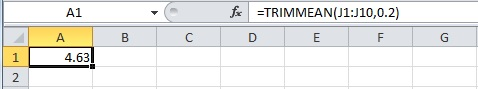
- Thus, the 10% Trimmed mean for the number of empty seats on Tuesday is 4.63.
For Wednesday:
Mean:
Software procedure:
Step-by-step software procedure to obtain Mean using EXCEL software is as follows:
- Open an EXCEL file.
- Enter the data in the column K in cells K1 to K10.
- In cell A1, enter the formula “=AVERAGE(K1:K10)”.
- Output using EXCEL software is given below:

Thus, the mean number of empty seats on Wednesday is 3.80.
Median:
Software procedure:
Step-by-step software procedure to obtain Median using EXCEL software is as follows:
- Open an EXCEL file.
- Enter the data in the column K in cells K1 to K10.
- In cell A1, enter the formula “=MEDIAN(K1:K10)”.
- Output using EXCEL software is given below:
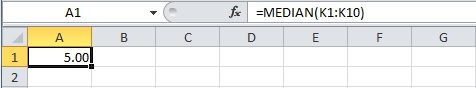
Thus, the median for the number of empty seats on Wednesday is 5.
Mode:
Software procedure:
Step-by-step software procedure to obtain Mode using EXCEL software is as follows:
- Open an EXCEL file.
- Enter the data in the column K in cells K1 to K10.
- In cell A1, enter the formula “=MODE.SNGL(K1:K10)”.
- Output using EXCEL software is given below:
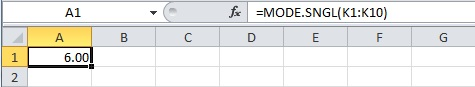
Thus, the mode for the number of empty seat on Wednesday is 6.
Geometric mean:
- Here, the data set on Wednesday contains zero, so, geometric mean is not applicable.
Midrange:
Software procedure:
Step-by-step software procedure to obtain Midrange using EXCEL software is as follows:
- Open an EXCEL file.
- Enter the data in the column K in cells K1 to K10.
- In cell A1, enter the formula “=(MIN(K1:K10)+MAX(K1:K10))/2”.
- Output using EXCEL software is given below:
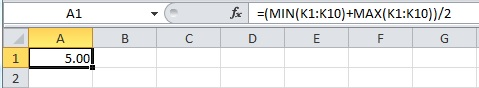
- Thus, the midrange for the number of empty seats on Wednesday is 5.
10% Trimmed mean:
Software procedure:
Step-by-step software procedure to obtain 10% Trimmed mean using EXCEL software is as follows:
- Open an EXCEL file.
- Enter the data in the column K in cells K1 to K10.
- In cell A1, enter the formula “=TRIMMEAN(K1:K10,0.2)”.
- Output using EXCEL software is given below:
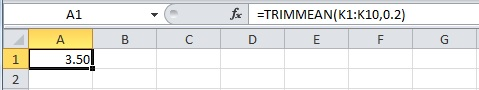
- Thus, the 10% Trimmed mean for the number of empty seats on Wednesday is 3.50.
For Thursday:
Mean:
Software procedure:
Step-by-step software procedure to obtain Mean using EXCEL software is as follows:
- Open an EXCEL file.
- Enter the data in the column L in cells L1 to L10.
- In cell A1, enter the formula “=AVERAGE(L1:L10)”.
- Output using EXCEL software is given below:
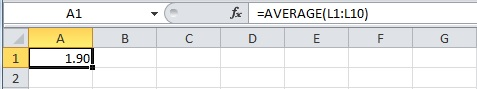
Thus, the mean number of empty seats on Thursday is 1.90.
Median:
Software procedure:
Step-by-step software procedure to obtain Median using EXCEL software is as follows:
- Open an EXCEL file.
- Enter the data in the column L in cells L1 to L10.
- In cell A1, enter the formula “=MEDIAN(L1:L10)”.
- Output using EXCEL software is given below:
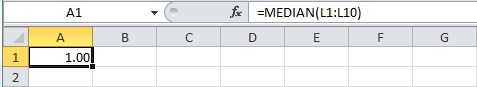
Thus, the median for the number of empty seats on Thursday is 5.
Mode:
Software procedure:
Step-by-step software procedure to obtain Mode using EXCEL software is as follows:
- Open an EXCEL file.
- Enter the data in the column L in cells L1 to L10.
- In cell A1, enter the formula “=MODE.SNGL(L1:L10)”.
- Output using EXCEL software is given below:
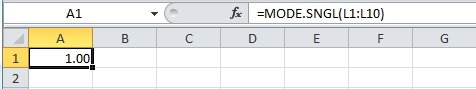
Thus, the mode for the number of empty seat on Thursday is 1.
Geometric mean:
Software procedure:
Step-by-step software procedure to obtain Geometric mean using EXCEL software is as follows:
- Open an EXCEL file.
- Enter the data in the column L in cells L1 to L10.
- In cell A1, enter the formula “=GEOMEAN(L1:L10)”.
- Output using EXCEL software is given below:
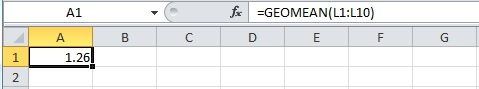
Thus, the geometric mean for the number of empty seats on Thursday is 1.26.
Midrange:
Software procedure:
Step-by-step software procedure to obtain Midrange using EXCEL software is as follows:
- Open an EXCEL file.
- Enter the data in the column L in cells L1 to L10.
- In cell A1, enter the formula “=(MIN(L1:L10)+MAX(L1:L10))/2”.
- Output using EXCEL software is given below:
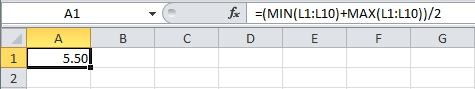
- Thus, the midrange for the number of empty seats on Thursday is 5.50.
10% Trimmed mean:
Software procedure:
Step-by-step software procedure to obtain 10% Trimmed mean using EXCEL software is as follows:
- Open an EXCEL file.
- Enter the data in the column L in cells L1 to L10.
- In cell A1, enter the formula “=TRIMMEAN(L1:L10,0.2)”.
- Output using EXCEL software is given below:
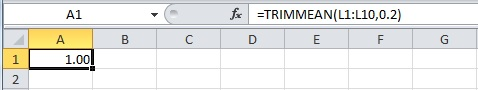
- Thus, the 10% Trimmed mean for the number of empty seats on Thursday is 1.
b.
Explain whether or not the measures of center agreed.
Answer to Problem 16SE
No, the measures of center are not agreed.
Explanation of Solution
The measures of center will not acceptable for the number of empty seats on flight 308. In this situation, the mode and geometric mean are totally different from the other measures. That is, the mean, median and the midrange for all days in a week has the similar values.
c.
Note the strength or weakness of the statistic of center.
Explanation of Solution
Strength of the statistic of the center:
Mean: it is more preferable for any statistical analysis which uses all information about the sample data.
Median: median will be more unaffected by the extreme values.
Mode: Of all the observations, mode is the undependable measure of center.
Weakness of the statistic of the center:
Mean: it is affected by the extreme values.
Median: it is affected by the gaps in the data value.
Mode: it is not helpful for continuous data.
When the strength or weakness is observed for each day, it is known that mode is the undependable for all the days. It is observed from the previous part (b), the mean and median are equal for all the days, so it acts as the strength of the statistic of center.
Want to see more full solutions like this?
Chapter 4 Solutions
Applied Statistics in Business and Economics with Connect Access Card with LearnSmart


 Glencoe Algebra 1, Student Edition, 9780079039897...AlgebraISBN:9780079039897Author:CarterPublisher:McGraw Hill