Applied Statistics in Business and Economics with Connect Access Card with LearnSmart
5th Edition
ISBN: 9781259396656
Author: David Doane, Lori Seward Senior Instructor of Operations Management
Publisher: McGraw-Hill Education
bartleby

Concept explainers

bartleby

Videos

Textbook Question
Book Icon
Chapter 4, Problem 93CE

(a) Make an Excel scatter plot of X = 1990 assault rate per 100,000 population and Y = 2004 assault rate per 100,000 population for the 50 U.S. states. (b) Use Excel’s =CORREL function to find the correlation coefficient. (c) What do the graph and correlation coefficient say about assault rates by state for these two years? (d) Use MegaStat or Excel to find the mean, median, and standard deviation of assault rates in these two years. What does this comparison tell you?

a.

Expert Solution
Check Mark
To determine

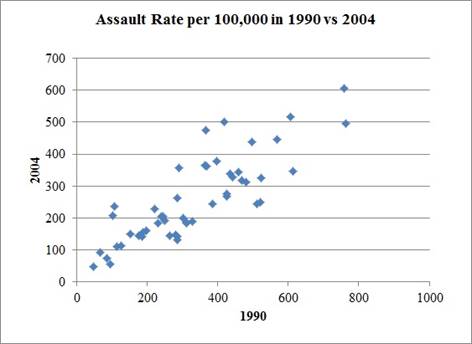
Construct a scatter plot for the assault rate per 100,000 populations using excel.

Answer to Problem 93CE

The scatter plot for the assault rate per 100,000 populations is as follows,

Applied Statistics in Business and Economics with Connect Access Card with LearnSmart, Chapter 4, Problem 93CE , additional homework tip  1

Explanation of Solution

Calculation:

The data set represents the assault rate per 100,000 population in the year 1990 and 2004 for the 50 U.S. states.

Scatter plot:

Software procedure:

Step-by-step software procedure to obtain the Scatter plot using EXCEL is as follows:

  • Open an EXCEL file.
  • In column A, enter the column of 1990, in column B enter the column of 2004.
  • Select the data that is to be displayed.
  • Click on Insert > select Scatter icon.
  • Click on the chart > select Layout from the Chart Tools.
  • Select Chart Title > Above Chart.
  • Enter Assault Rate per 100,000 in 1990 vs 2004 in the dialog box
  • Select Axis Title > Primary Horizontal Axis Title > Title Below Axis.
  • Enter 1990 in the dialog box.
  • Select Axis Title > Primary Vertical Axis Title > Rotated Title.
  • Enter 2004 in the dialog box.
  • Thus, the scatter plot for the assault rate per 100,000 populations has been obtained using Excel.

b.

Expert Solution
Check Mark
To determine

Find the correlation coefficient using Excel.

Answer to Problem 93CE

The correlation coefficient for the assault rate per 100,000 population in the years 1990 and 2004 is 0.8332.

Explanation of Solution

Calculation:

Correlation:

The correlation coefficient, r, between ordered pairs of variables, (x, y) having sample means x¯ and y¯, for a sample of size n is given as r=i=1n(xix¯)(yiy¯)i=1n(xix¯)2i=1n(yiy¯)2. The correlation coefficient is useful for measuring the strength of the linear relationship between the two variables.

Software procedure:

Step-by-step software procedure to obtain correlation coefficient using EXCEL software is as follows:

  • Open an EXCEL file.
  • Enter the data in the column I in cells I1 to I50 and column J in cells J1 to J50.
  • In cell A1, enter the formula “=CORREL(I1:I50,J1:J50)”.
  • Output using EXCEL software is given below:

Applied Statistics in Business and Economics with Connect Access Card with LearnSmart, Chapter 4, Problem 93CE , additional homework tip  2

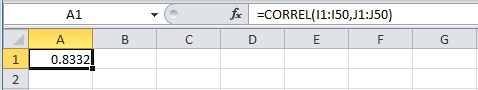
Thus, the Correlation coefficient for the assault rate per 100,000 population between the years 1990 and 2004 is 0.8332.

c.

Expert Solution
Check Mark
To determine

Describe about the assault rates by the states for the year 1990 and 2004 as stated by the graph and correlation coefficient.

Explanation of Solution

Linear relationship:

If two variables are such that, when they are plotted on a scatterplot the data clusters around a straight line, then the variables are said to have a linear association or a linear relationship.

Interpretation of the correlation coefficient:

The correlation coefficient, r, between two linearly related variables is interpreted as follows:

  • A positive value of r indicates a positive linear relationship.
  • A negative value of r indicates a negative linear relationship.
  • A value of r close to 0 indicates a weak linear relationship.
  • A value of r close to 1 indicates a strong positive linear relationship.
  • A value of r close to –1 indicates a strong negative linear relationship.
  • The value r=1 indicates a perfect positive linear relationship.
  • The value r=1 indicates a perfect negative linear relationship.

From the previous part (b), the sample correlation coefficient is 0.8332.

A careful inspection of the scatterplot and correlation coefficient reveals that the data are clustered around a straight line and correlation coefficient is near to 1, indicating that there exists a strong positive linear relationship between the two variables considered, assault rate in the year 1990 and assault rate in the year 2004.

Thus, there is a strong positive linear relationship between the assault rate in the year 1990 and assault rate in the year 2004.

d.

Expert Solution
Check Mark
To determine

Calculate the sample mean, median and standard deviation.

Answer to Problem 93CE

The Mean, Median and Standard deviation are:

Measures19902004
Mean331.92256.6
Median307232
Standard deviation172.91131.26

Explanation of Solution

Calculation:

For 1990:

Mean:

Software procedure:

Step-by-step software procedure to obtain Mean using EXCEL software is as follows:

  • Open an EXCEL file.
  • Enter the data in the column I in cells I1 to I50.
  • In cell A1, enter the formula “=AVERAGE(I1:I50)”.
  • Output using EXCEL software is given below:

Applied Statistics in Business and Economics with Connect Access Card with LearnSmart, Chapter 4, Problem 93CE , additional homework tip  3

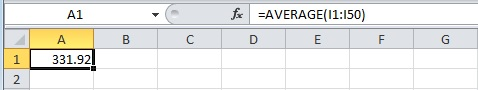
Thus, the mean for the assault rate in 1990 is 331.92.

Median:

Software procedure:

Step-by-step software procedure to obtain Median using EXCEL software is as follows:

  • Open an EXCEL file.
  • Enter the data in the column I in cells I1 to I50.
  • In cell A1, enter the formula “=MEDIAN(I1:150)”.
  • Output using EXCEL software is given below:

Applied Statistics in Business and Economics with Connect Access Card with LearnSmart, Chapter 4, Problem 93CE , additional homework tip  4

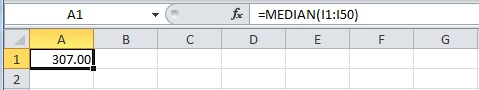
Thus, the median for assault rate in 1990 is 307.

Standard deviation:

Software procedure:

Step-by-step software procedure to obtain Standard deviation using EXCEL software is as follows:

  • Open an EXCEL file.
  • Enter the data in the column I in cells I1 to I50.
  • In cell A1, enter the formula “=STDEV(I1:I50)”.
  • Output using EXCEL software is given below:

Applied Statistics in Business and Economics with Connect Access Card with LearnSmart, Chapter 4, Problem 93CE , additional homework tip  5

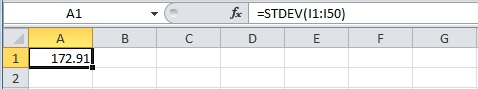
Thus, the standard deviation for assault rate in 1990 is 172.91.

For 2004:

Mean:

Software procedure:

Step-by-step software procedure to obtain Mean using EXCEL software is as follows:

  • Open an EXCEL file.
  • Enter the data in the column J in cells J1 to J50.
  • In cell A1, enter the formula “=AVERAGE(J1:J50)”.
  • Output using EXCEL software is given below:

Applied Statistics in Business and Economics with Connect Access Card with LearnSmart, Chapter 4, Problem 93CE , additional homework tip  6

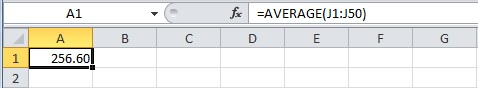
Thus, the mean for the assault rate in 2004 is 256.60.

Median:

Software procedure:

Step-by-step software procedure to obtain Median using EXCEL software is as follows:

  • Open an EXCEL file.
  • Enter the data in the column J in cells J1 to J50.
  • In cell A1, enter the formula “=MEDIAN(J1:J50)”.
  • Output using EXCEL software is given below:

Applied Statistics in Business and Economics with Connect Access Card with LearnSmart, Chapter 4, Problem 93CE , additional homework tip  7

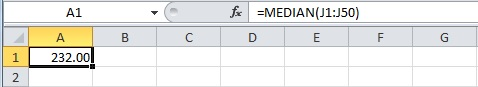
Thus, the median for assault rate in 2004 is 232.

Standard deviation:

Software procedure:

Step-by-step software procedure to obtain Standard deviation using EXCEL software is as follows:

  • Open an EXCEL file.
  • Enter the data in the column J in cells J1 to J50.
  • In cell A1, enter the formula “=STDEV(J1:J50)”.
  • Output using EXCEL software is given below:

Applied Statistics in Business and Economics with Connect Access Card with LearnSmart, Chapter 4, Problem 93CE , additional homework tip  8

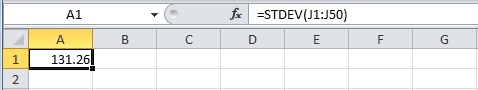
Thus, the standard deviation for assault rate in 2004 is 131.26.

A comparison of the values of measures shows that the assault rate in 1990 was greater than that of the assault rate in 2004.

Want to see more full solutions like this?

Subscribe now to access step-by-step solutions to millions of textbook problems written by subject matter experts!

Chapter 4 Solutions

Applied Statistics in Business and Economics with Connect Access Card with LearnSmart

Ch. 4.2 - Prob. 11SECh. 4.2 - Prob. 12SECh. 4.2 - (a) Write the Excel function for the 10 percent...Ch. 4.2 - Prob. 14SECh. 4.2 - Prob. 15SECh. 4.2 - Spirit Airlines kept track of the number of empty...Ch. 4.2 - CitiBank recorded the number of customers to use a...Ch. 4.2 - On Friday night, the owner of Chez Pierre in...Ch. 4.2 - Prob. 19SECh. 4.2 - Prob. 20SECh. 4.3 - (a) Find the mean and standard deviation for each...Ch. 4.3 - For each data set: (a) Find the mean. (b) Find the...Ch. 4.3 - In fuel economy tests in city driving conditions,...Ch. 4.3 - Over the past month, Bobs bowling score mean was...Ch. 4.3 - Prob. 25SECh. 4.3 - Prob. 26SECh. 4.3 - (a) Find the coefficient of variation for prices...Ch. 4.3 - Prob. 28SECh. 4.3 - Noodles and Company tested consumer reaction to...Ch. 4.4 - (a) By Chebyshevs Theorem, at least how many...Ch. 4.4 - An exam has a mean of 70 with a standard deviation...Ch. 4.4 - Prob. 32SECh. 4.4 - The mean collection period for accounts receivable...Ch. 4.4 - Prob. 34SECh. 4.4 - Prob. 35SECh. 4.4 - Prob. 36SECh. 4.4 - Find the original data value corresponding to each...Ch. 4.4 - CitiBank recorded the number of customers to use a...Ch. 4.4 - Prob. 39SECh. 4.5 - Scores on an accounting exam ranged from 42 to 96,...Ch. 4.5 - In 2007, total compensation (in thousands of...Ch. 4.5 - Waiting times (minutes) for a table at Joeys BBQ...Ch. 4.5 - Coffee temperatures (degrees Fahrenheit) at a...Ch. 4.5 - Prob. 44SECh. 4.5 - On San Martin Boulevard, embedded sensors kept...Ch. 4.5 - Prob. 46SECh. 4.5 - Prob. 47SECh. 4.6 - For each X-Y data set (n = 12): (a) Make a scatter...Ch. 4.6 - Your laptop gets warm (even hot) when you place it...Ch. 4.6 - Prob. 50SECh. 4.6 - Prob. 51SECh. 4.7 - Estimate the mean from this table of grouped data...Ch. 4.7 - Estimate the mean from the following table of...Ch. 4 - What are descriptive statistics? How do they...Ch. 4 - Explain each concept: (a) center, (b) variability,...Ch. 4 - Prob. 3CRCh. 4 - List strengths and weaknesses of each measure of...Ch. 4 - Prob. 5CRCh. 4 - (a) What is a bimodal distribution? (b) Explain...Ch. 4 - Prob. 7CRCh. 4 - Prob. 8CRCh. 4 - (a) Which standard deviation formula (population,...Ch. 4 - (a) To what kind of data does Chebyshevs Theorem...Ch. 4 - Prob. 11CRCh. 4 - Prob. 12CRCh. 4 - Prob. 13CRCh. 4 - Prob. 14CRCh. 4 - (a) Explain the method of medians for calculating...Ch. 4 - (a) What is a box plot? What does it tell us? (b)...Ch. 4 - Prob. 17CRCh. 4 - Prob. 18CRCh. 4 - Prob. 19CRCh. 4 - (a) What is kurtosis? (b) Sketch a platykurtic...Ch. 4 - Prob. 54CECh. 4 - If the mean asset turnover for retail firms is...Ch. 4 - Prob. 56CECh. 4 - During a rock concert, the noise level (in...Ch. 4 - Bags of jelly beans have a mean weight of 396 gm...Ch. 4 - Based on experience, the Ball Corporations...Ch. 4 - SAT scores for the entering class of 2010 at...Ch. 4 - Prob. 61CECh. 4 - The average time a Boulder High varsity lacrosse...Ch. 4 - Prob. 63CECh. 4 - Below are monthly rents paid by 30 students who...Ch. 4 - How many days in advance do travelers purchase...Ch. 4 - The durations (minutes) of 26 electric power...Ch. 4 - The U.S. Postal Service will ship a Priority Mail...Ch. 4 - Prob. 68CECh. 4 - Prob. 69CECh. 4 - Prob. 70CECh. 4 - Prob. 71CECh. 4 - A plumbing suppliers mean monthly demand for vinyl...Ch. 4 - Prob. 73CECh. 4 - Prob. 74CECh. 4 - Prob. 75CECh. 4 - Caffeine content in a 5-ounce cup of brewed coffee...Ch. 4 - Prob. 77CECh. 4 - Prob. 78CECh. 4 - Prob. 79CECh. 4 - Prob. 80CECh. 4 - Prob. 81CECh. 4 - The median waiting time for a liver transplant in...Ch. 4 - A small suburban community agreed to purchase...Ch. 4 - A companys contractual trigger point for a union...Ch. 4 - Prob. 85CECh. 4 - (a) Enter the Excel function...Ch. 4 - Note: In each of the following tables, the upper...Ch. 4 - Prob. 88CECh. 4 - The self-reported number of hours worked per week...Ch. 4 - How long does it take to fly from Denver to...Ch. 4 - (a) Make an Excel scatter plot of X = 1990 assault...Ch. 4 - (a) Make an Excel scatter plot of X = airspeed...Ch. 4 - Prob. 95CECh. 4 - Prob. 1ERQCh. 4 - Which is not an ethical obligation of a...Ch. 4 - Prob. 3ERQCh. 4 - Prob. 4ERQCh. 4 - Give the type of measurement (nominal, ordinal,...Ch. 4 - Prob. 6ERQCh. 4 - To choose a sample of 12 students from a...Ch. 4 - Which of the following is not a reason for...Ch. 4 - Which statement is correct? Why not the others? a....Ch. 4 - Prob. 10ERQCh. 4 - The management of a theme park obtained a random...Ch. 4 - Which one of the following is true? Why not the...Ch. 4 - Prob. 13ERQCh. 4 - Prob. 14ERQCh. 4 - Here are the ages of a random sample of 20 CEOs...Ch. 4 - Prob. 16ERQCh. 4 - Prob. 17ERQCh. 4 - Prob. 18ERQCh. 4 - Which is not a characteristic of using a log scale...
Knowledge Booster
Background pattern image
Statistics
Learn more about
Need a deep-dive on the concept behind this application? Look no further. Learn more about this topic, statistics and related others by exploring similar questions and additional content below.
Recommended textbooks for you
Text book image
Glencoe Algebra 1, Student Edition, 9780079039897...
Algebra
ISBN:9780079039897
Author:Carter
Publisher:McGraw Hill
Text book image
Big Ideas Math A Bridge To Success Algebra 1: Stu...
Algebra
ISBN:9781680331141
Author:HOUGHTON MIFFLIN HARCOURT
Publisher:Houghton Mifflin Harcourt
Correlation Vs Regression: Difference Between them with definition & Comparison Chart; Author: Key Differences;https://www.youtube.com/watch?v=Ou2QGSJVd0U;License: Standard YouTube License, CC-BY
Correlation and Regression: Concepts with Illustrative examples; Author: LEARN & APPLY : Lean and Six Sigma;https://www.youtube.com/watch?v=xTpHD5WLuoA;License: Standard YouTube License, CC-BY