
Concept explainers
Videos
a.
Find the median, midrange and geometric mean of the Exam scores of 9 students.
a.
Answer to Problem 12SE
The median of the Exam scores of 9 students is 68.
The geometric mean of the Exam scores of 9 students is 67.37013.
The midrange of the Exam scores of 9 students is 68.
Explanation of Solution
The Exam scores of 9 students is given.
Measures of center:
- Median is the middle value in an ordered sequence of data.
- Geometric mean is the multiplication all the data values in the sample by taking nth root of the product and will be affected in the case of zeros and negative values in the observation.
- Midrange is the point between the lowest and highest values of X that occurs in halfway.
Median:
Software procedure:
Step-by-step software procedure to obtain Median using EXCEL software is as follows:
- Open an EXCEL file.
- Enter the data in the column J in cells J1 to J9.
- In cell A1, enter the formula “=MEDIAN(J1:J9)”.
- Output using EXCEL software is given below:
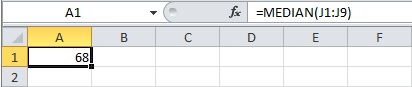
Thus, the median is 68.
Geometric mean:
Software procedure:
Step-by-step software procedure to obtain Geometric mean using EXCEL software is as follows:
- Open an EXCEL file.
- Enter the data in the column J in cells J1 to J9.
- In cell A1, enter the formula “=GEOMEAN(J1:J9)”.
- Output using EXCEL software is given below:
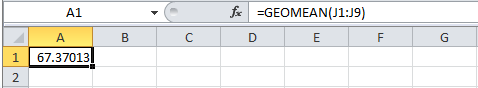
Thus, the geometric mean is 67.37013.
Midrange:
Software procedure:
Step-by-step software procedure to obtain Midrange using EXCEL software is as follows:
- Open an EXCEL file.
- Enter the data in the column J in cells J1 to J9.
- In cell A1, enter the formula “=(MIN(J1:J9)”+MAX(J1:J9))/2”.
- Output using EXCEL software is given below:
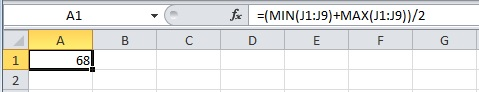
- Thus, the midrange is 68.
b.
Decide whether the given measures are reasonable measures of center tendency.
b.
Answer to Problem 12SE
Yes, the given measures are reasonable measures of center tendency.
Explanation of Solution
From the data, it is observed that there occurs one extreme value. Median and mid-
Hence, the given measures are reasonable measures of center tendency.
A (b).
Find the median, midrange and geometric mean of the GPAs of 8 students.
A (b).
Answer to Problem 12SE
The median of the GPAs of 8 students is 3.03.
The geometric mean of the GPAs of 8 students is 3.009403.
The midrange of the GPAs of 8 students is 2.955.
Explanation of Solution
The GPAs of 8 students is given.
Median:
Software procedure:
Step-by-step software procedure to obtain Median using EXCEL software is as follows:
- Open an EXCEL file.
- Enter the data in the column K in cells K1 to K8.
- In cell A1, enter the formula “=MEDIAN(K1:K8)”.
- Output using EXCEL software is given below:

Thus, the median is 3.03.
Geometric mean:
Software procedure:
Step-by-step software procedure to obtain Geometric mean using EXCEL software is as follows:
- Open an EXCEL file.
- Enter the data in the column K in cells K1 to K8.
- In cell A1, enter the formula “=GEOMEAN(K1:K8)”.
- Output using EXCEL software is given below:
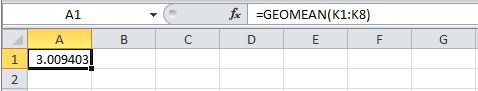
Thus, the geometric mean is 3.009403.
Midrange:
Software procedure:
Step-by-step software procedure to obtain Midrange using EXCEL software is as follows:
- Open an EXCEL file.
- Enter the data in the column K in cells K1 to K8.
- In cell A1, enter the formula “=(MIN(K1:K8)+MAX(K1:K8))/2”.
- Output using EXCEL software is given below:
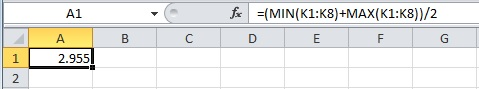
- Thus, the midrange is 2.955.
b.
Decide whether the given measures are reasonable measures of center tendency.
b.
Answer to Problem 12SE
Yes, the given measures are reasonable measures of center tendency.
Explanation of Solution
From the data, it is observed that there occurs no extreme value. Median and mid-range has similar values. In this context, all the measures like median, midrange and geometric
Hence, the given measures are reasonable measures of center tendency.
a.
Find the median, midrange and geometric mean of the class absences of 12 students.
a.
Answer to Problem 12SE
The median of the class absences of 12 students is 1.5.
The Geometric mean of the class absences of 12 students is not applicable.
The midrange of the class absences of 12 students is 7.5.
Explanation of Solution
The class absence of 12 students is given.
Median:
Software procedure:
Step-by-step software procedure to obtain Median using EXCEL software is as follows:
- Open an EXCEL file.
- Enter the data in the column L in cells L1 to L12.
- In cell A1, enter the formula “=MEDIAN(L1:L12)”.
- Output using EXCEL software is given below:
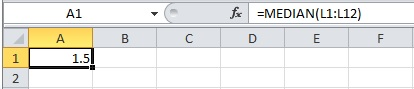
Thus, the median is 1.5.
Geometric mean:
Here, the observations contain zero. As a result, the geometric mean is not applicable.
Midrange:
Software procedure:
Step-by-step software procedure to obtain Midrange using EXCEL software is as follows:
- Open an EXCEL file.
- Enter the data in the column L in cells L1 to L12.
- In cell A1, enter the formula “=(MIN(L1:L12)+MAX(L1:L12))/2”.
- Output using EXCEL software is given below:
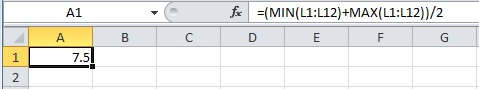
- Thus, the midrange is 7.5.
b.
Decide whether the given measures are reasonable measures of center tendency.
b.
Answer to Problem 12SE
No, the given measures are not all reasonable measures of center tendency
Explanation of Solution
From the data, it is observed that there occurs one extreme value, 15. Median and mid-range have extremely different values. The value of the geometric mean is not defined. So, the measures are not acceptable.
Hence, the given measures are not reasonable measures of center tendency.
Want to see more full solutions like this?
Chapter 4 Solutions
Applied Statistics in Business and Economics with Connect Access Card with LearnSmart


 MATLAB: An Introduction with ApplicationsStatisticsISBN:9781119256830Author:Amos GilatPublisher:John Wiley & Sons Inc
 Probability and Statistics for Engineering and th...StatisticsISBN:9781305251809Author:Jay L. DevorePublisher:Cengage Learning
 Statistics for The Behavioral Sciences (MindTap C...StatisticsISBN:9781305504912Author:Frederick J Gravetter, Larry B. WallnauPublisher:Cengage Learning
 Elementary Statistics: Picturing the World (7th E...StatisticsISBN:9780134683416Author:Ron Larson, Betsy FarberPublisher:PEARSON
 The Basic Practice of StatisticsStatisticsISBN:9781319042578Author:David S. Moore, William I. Notz, Michael A. FlignerPublisher:W. H. Freeman
 Introduction to the Practice of StatisticsStatisticsISBN:9781319013387Author:David S. Moore, George P. McCabe, Bruce A. CraigPublisher:W. H. Freeman