
Numerical Analysis
3rd Edition
ISBN: 9780134696454
Author: Sauer, Tim
Publisher: Pearson,
expand_more
expand_more
format_list_bulleted
Concept explainers
Videos
Textbook Question
Chapter 4.2, Problem 1CP
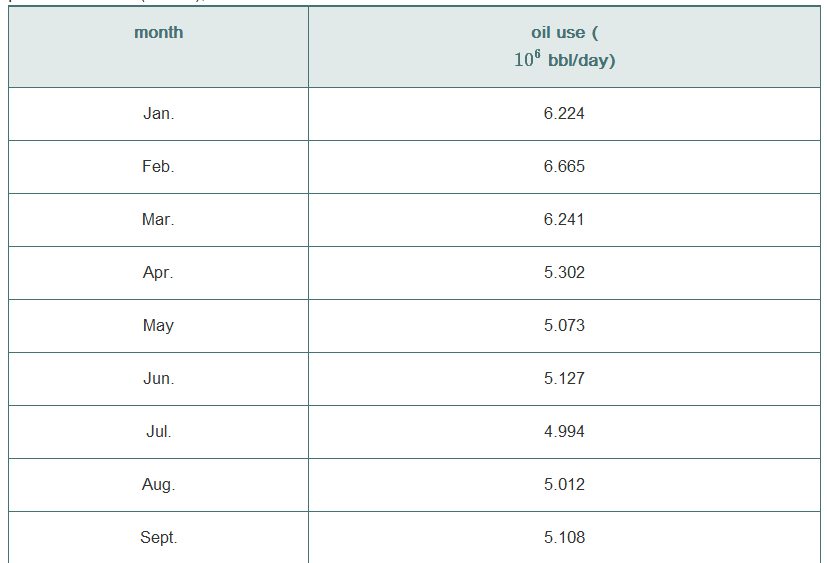
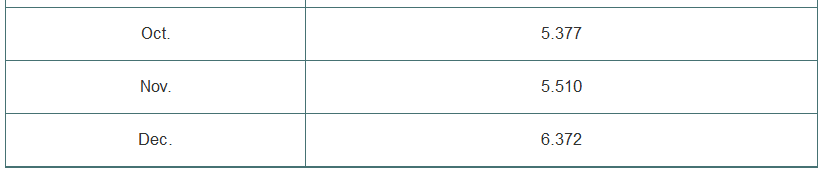
Fit the monthly data for Japan 2003 oil consumption, shown in the following table, with the periodic model (4.9) and calculate the RMSE:
Expert Solution & Answer
Want to see the full answer?
Check out a sample textbook solution
Students have asked these similar questions
1. Interpret the data which has been presented in thr below Table 1 and Table 2.
To see the effect of a relatively small error in the estimate of the amount of carbon-14 in a sample being dated, consider this hypothetical situation:
a. A bone fragment found in central Illinois in the year 2000 contains 17% of its original carbon-14 content. Estimate the year the animal died.
b. Repeat part (a), assuming 18% instead of 17%.
c. Repeat part (a), assuming 16% instead of 17.
The following graph shows the approximate value V(t) of subprime (normally classified as risky) mortgage debt outstanding in the United States.
Chapter 4 Solutions
Numerical Analysis
Ch. 4.1 - Solve the normal equations to find the least...Ch. 4.1 - Find the least squares solutions and RMSE of the...Ch. 4.1 - Find the least squares solution of the...Ch. 4.1 - Let mn, let A be the mn identity matrix (the...Ch. 4.1 - Prove that the 2-norm is a vector norm. You...Ch. 4.1 - Let A be an nn nonsingular matrix. (a) Prove that...Ch. 4.1 - Find the best line through the set of data points,...Ch. 4.1 - Find the best line through the set of data points,...Ch. 4.1 - Find the best parabola through each data point set...Ch. 4.1 - Find the best degree 3 polynomial through each set...
Ch. 4.1 - Assume that the height of a model rocket is...Ch. 4.1 - Given data points...Ch. 4.1 - Form the normal equations, and compute the least...Ch. 4.1 - Prob. 2CPCh. 4.1 - Prob. 3CPCh. 4.1 - Prob. 4CPCh. 4.1 - 5. A company test-markets a new soft drink in 22...Ch. 4.1 - What is the slope of the parabola y=x2on[ 0,1 ] ?...Ch. 4.1 - Find the least squares (a) line (b) parabola...Ch. 4.1 - Let A be the 10n matrix formed by the first n...Ch. 4.1 - Prob. 9CPCh. 4.1 - The following data, collected by U.S. Bureau of...Ch. 4.2 - Fit data to the periodic model...Ch. 4.2 - Fit the data to the periodic models...Ch. 4.2 - Fit data to the exponential model by using...Ch. 4.2 - Prob. 4ECh. 4.2 - Fit data to the power law model by using...Ch. 4.2 - Prob. 6ECh. 4.2 - Fit the monthly data for Japan 2003 oil...Ch. 4.2 - Prob. 2CPCh. 4.2 - Prob. 3CPCh. 4.2 - Prob. 4CPCh. 4.2 - Prob. 5CPCh. 4.2 - Prob. 6CPCh. 4.2 - Prob. 7CPCh. 4.2 - The file scrippsy. txt, available from the...Ch. 4.2 - The file scrippsm.txt, available from the textbook...Ch. 4.3 - Apply classical Gram-Schmidt orthogonalization to...Ch. 4.3 - Apply classical Gram-Schmidt orthogonalization to...Ch. 4.3 - Apply modified Gram--Schmidt orthogonalization to...Ch. 4.3 - Apply modified Gram-Schmidt orthogonalization to...Ch. 4.3 - Prob. 5ECh. 4.3 - Prob. 6ECh. 4.3 - Prob. 7ECh. 4.3 - Find the QR factorization and use it to solve the...Ch. 4.3 - Prove that a square matrix is orthogonal if and...Ch. 4.3 - Prove that the product of two orthogonal mm...Ch. 4.3 - Show that the Gram-Schmidt orthogonalization of an...Ch. 4.3 - Show that the Householder reflector method for the...Ch. 4.3 - Let P be the matrix defined in (4.29). Show (a)...Ch. 4.3 - Prob. 14ECh. 4.3 - Prob. 15ECh. 4.3 - Write a MATLAB program that implements the...Ch. 4.3 - Apply the classical Gram-Schmidt, modified...Ch. 4.3 - Prob. 3CPCh. 4.3 - Write a MATLAB program that implements (a)...Ch. 4.3 - Prob. 5CPCh. 4.3 - Use the MATLAB QR factorization to find the least...Ch. 4.3 - Prob. 7CPCh. 4.3 - Let x1,...,x11be11 be evenly spaced points in...Ch. 4.4 - Solve Ax=b for the following A and b=[ 1,0,0 ]T,...Ch. 4.4 - Prob. 2ECh. 4.4 - Let A=[ 10a1301a23001 ]. Prove that for any x0 and...Ch. 4.4 - Prob. 4ECh. 4.4 - Prob. 1CPCh. 4.4 - Prob. 2CPCh. 4.4 - Prob. 3CPCh. 4.4 - Let A be the matrix from Computer Problem 3, but...Ch. 4.4 - Prob. 5CPCh. 4.5 - The Gauss-Newton Method can be applied to find the...Ch. 4.5 - Prob. 2ECh. 4.5 - Prove that the distance from a point (x,y) to a...Ch. 4.5 - Prob. 4ECh. 4.5 - Find the matrix Dr needed for the application of...Ch. 4.5 - Prob. 6ECh. 4.5 - Prob. 7ECh. 4.5 - Prob. 1CPCh. 4.5 - Prob. 2CPCh. 4.5 - Prob. 3CPCh. 4.5 - Prob. 4CPCh. 4.5 - Prob. 5CPCh. 4.5 - Prob. 6CPCh. 4.5 - Prob. 7CPCh. 4.5 - Prob. 8CPCh. 4.5 - Prob. 9CPCh. 4.5 - Prob. 10CPCh. 4.5 - Prob. 11CPCh. 4.5 - Prob. 1SACh. 4.5 - Prob. 2SACh. 4.5 - Prob. 3SACh. 4.5 - Prob. 4SACh. 4.5 - Now repeat Step 4 with a more tightly grouped set...Ch. 4.5 - Decide whether the GPS en-or and condition number...
Knowledge Booster


Learn more about
Need a deep-dive on the concept behind this application? Look no further. Learn more about this topic, subject and related others by exploring similar questions and additional content below.Similar questions
- Which of the above forecasts has lowest magnitude in relative terms? a. 3-period moving average B. Simple Moving Average c. (6,4,3,2) D. Alpha = .3arrow_forwardAn article in the ASCE Journal of Energy Engineering [“Overview of Reservoir Release Improvements at 20 TVA Dams” (Vol. 125, April 1999, pp. 1–17)] presents data on dissolved oxygen concentrations in streams below 20 dams in the Tennessee Valley Authority system. The observations are (in milligrams per liter):arrow_forwardFrom the following data points (15, 24), (18, 37), (22, 25), find the Newton’s second-order divided difference. Round-off to three decimals.arrow_forward
- The flash point of an engine oil is 363°F. What is the absolute flashpoint temperature in K and R?arrow_forwardQuestion 21 Use the attached information to answer Question 21 and Question 22.Evaluate the Paasche Price index for 2020 using 2010 as the base year for the above data.A. 117.7B. 120.1C. 138.9D. 141.8 Question 22 Evaluate the Laspeyres Quantity index for 2020 using 2010 as the base year for the above data.A. 117.7B. 120.1C. 138.9D. 141.8arrow_forwardDefine the following: Heaviside step function Unit Step Function The Dirac Delta Function Deflection of a Beamarrow_forward
- Kaitlyn measures the upload speed in megabits per second of her home broadband internet connection during peak hours and off-peak hours. The results are provided in the accompanying table. Peak Off-Peak 5.83 5.14 6.05 6.80 7.14 6.98 3.54 5.77 5.45 7.27 5.90 6.62 5.81 6.19 4.82 6.08 6.37 6.59 4.65 5.58 5.30 7.41 6.48 6.26 5.96 6.37 5.79 6.31 6.84 6.55 5.06 4.95 5.61 7.03 6.45 6.77 Examine the results of Kaitlyn's test to determine the statements that compare the medians and interquartile ranges of the data sets to each other in terms of this situation. Select the two correct answers. The median upload speed during peak hours is 5.905 megabits per second, which is less than the median upload speed during off-peak hours, 7.005 megabits per second. The upload speeds during peak hours are slower on average compared to off-peak times. The median upload speed during peak hours is 6.37 megabits per second, which is greater than the median upload speed during…arrow_forwardThe following is the data of inflation rates in the Japan from 2011 to 2019. Determine the rate in the years 2013, 2016, and 2018 using Lagrange Interpolation. Show the solutionarrow_forwardBriefly outline Autoregressive Integrated Moving Average (ARIMA) models and illustrate their application for time-series modelling.arrow_forward
arrow_back_ios
arrow_forward_ios
Recommended textbooks for you
 Mathematics For Machine TechnologyAdvanced MathISBN:9781337798310Author:Peterson, John.Publisher:Cengage Learning,
Mathematics For Machine Technology
Advanced Math
ISBN:9781337798310
Author:Peterson, John.
Publisher:Cengage Learning,
Mod-01 Lec-01 Discrete probability distributions (Part 1); Author: nptelhrd;https://www.youtube.com/watch?v=6x1pL9Yov1k;License: Standard YouTube License, CC-BY
Discrete Probability Distributions; Author: Learn Something;https://www.youtube.com/watch?v=m9U4UelWLFs;License: Standard YouTube License, CC-BY
Probability Distribution Functions (PMF, PDF, CDF); Author: zedstatistics;https://www.youtube.com/watch?v=YXLVjCKVP7U;License: Standard YouTube License, CC-BY
Discrete Distributions: Binomial, Poisson and Hypergeometric | Statistics for Data Science; Author: Dr. Bharatendra Rai;https://www.youtube.com/watch?v=lHhyy4JMigg;License: Standard Youtube License