ELEMENTARY STATISTICS LOOSE+ACCESS COD
2nd Edition
ISBN: 9781260020496
Author: Navidi
Publisher: MCG
bartleby

Concept explainers

bartleby

Videos

Textbook Question
Book Icon
Chapter 4.2, Problem 25E

Foot temperatures: Foot ulcers are a common problem for people with diabetes. Higher skin temperatures on the foot indicate an increased risk of ulcers. In a study carried out at the Colorado School of Mines, skin temperatures on both feet were measured, in degrees Fahrenheit, for 18 diabetic patients. The results are presented in the following table.

Chapter 4.2, Problem 25E, Foot temperatures: Foot ulcers are a common problem for people with diabetes. Higher skin

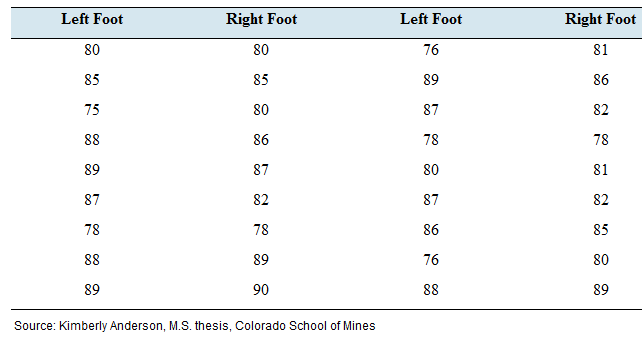
  1. Compute due least-squares regression line for predicting right foot temperature from the left foot temperature.
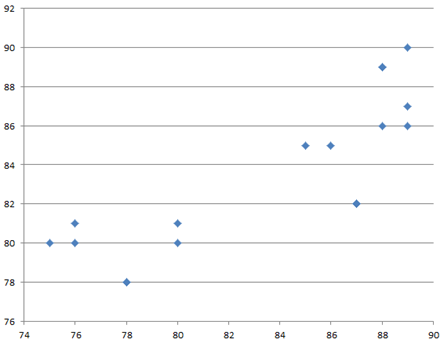
  2. Construct a scatter-plot (y) versus the left foot temperature Graph the least-squares regression line on the same axes.
  3. If the left foot temperatures of two patients differ by 2 degrees: by how much would you predict their right foot temperatures to differ?
  4. Predict the right foot temperature for a patient whose left foot temperature is 81 degrees.

a.

Expert Solution
Check Mark
To determine

To find: The least-square regression line for the given data set.

Answer to Problem 25E

The least square regression line of the given data set is,

  y^=25.06161.5881x

Explanation of Solution

The foot temperature of both foots are measured of 18 patients for a study to determine the risk of foot ulcers. Following table shows the measurements in Fahrenheit.

  Left footRight footLeft footRight foot808076818585898675808782888678788987808187828782787886858889768089908889

Calculation:

The least-square regression is given by the formula,

  y^=b0+b1x

Where b1=rsysx and b0=y¯b1x¯

  r is the correlation coefficient.

  sx is the standard deviation of x .

  sy is the standard deviation of y .

The correlation coefficient is given by the formula,

  r=1n1( x x ¯ s x )( y y ¯ s y )

Supposing the variable x is the temperature of left foot and y is the temperature of right foot, the means and the standard deviations should be calculated to find the slope and the intercept of the line.

  ELEMENTARY STATISTICS LOOSE+ACCESS COD, Chapter 4.2, Problem 25E , additional homework tip  1

Using the data above, Minitab, the correlation coefficient can be obtained by the following table.

   x y x x ¯ s x y y ¯ s y ( x x ¯ s x )( y y ¯ s y ) 80 80 0.7003 0.8868 0.6210 85 85 0.2547 0.4216 0.1073 75 80 1.6553 0.8868 1.4679 88 86 0.8277 0.6833 0.5655 89 87 1.0187 0.9449 0.9626 87 82 0.6367 0.3634 0.2314 78 78 1.0823 1.4101 1.5262 88 89 0.8277 1.4683 1.2152 89 90 1.0187 1.7299 1.7622 76 81 1.4643 0.6251 0.9154 89 86 1.0187 0.6833 0.6960 87 82 0.6367 0.3634 0.2314 78 78 1.0823 1.4101 1.5262 80 81 0.7003 0.6251 0.4378 87 82 0.6367 0.3634 0.2314 86 85 0.4457 0.4216 0.1879 76 80 1.4643 0.8868 1.2985 88 89 0.8277 1.4683 1.2152

   ( x x ¯ s x )( y y ¯ s y ) =13.8109

Hence, the correlation coefficient is,

  r=1181×13.8109=13.810917r=0.8124

Then, the coefficient b1 should be,

  b1=rsysx=0.8124×3.82165.2356b1=0.5930

Therefore,

  b0=y¯b1x¯=83.3889(0.5930)×83.6667=83.388933.7754b0=49.6135

Conclusion:

The least square regression line is found to be,

  y^=49.6153+0.5930x

b.

Expert Solution
Check Mark
To determine

To graph:The scatter plot for the given data.

Explanation of Solution

Graph:

The scatter plot for the given data can be constructed by considering the temperature of left foot as x variable and the temperature of right foot as y variable.

  ELEMENTARY STATISTICS LOOSE+ACCESS COD, Chapter 4.2, Problem 25E , additional homework tip  2

Interpretation:

Out of all these 18 ordered pairs, two clusters can be identified mainly. One is located in left-down of the plot and the other one is located right-up. In the middle area of the plot, no point can be observed.

c.

Expert Solution
Check Mark
To determine

To find:The temperature change of right foot for a change of 2 Fahrenheit in the temperature of left foot.

Answer to Problem 25E

An increase of 1.1860 Fahrenheit in the temperature of right foot can be expected for a 2 Fahrenheit change of the temperature in left foot.

Explanation of Solution

Given:

The least-square regression line has been obtained as y^=49.6153+0.5930x . This formula can be used to predict the values of y for a certain x value.

Calculation:

Let x0 be the left foot temperature of a particular patient. Then x0+2 is the amount that is larger than x0 by 2 .

Then the corresponding prediction for the right foot temperature for x0 can be obtained as,

  y^x0=49.6153+0.5930x0

Also, for x0+2 ,

  y^x0+2=49.6153+0.5930(x0+2)

The second relationship can be simplified as follows.

  y^x0+2=49.6153+0.5930(x0+2)=49.6153+0.5930 x 0 y ^ x 0 +0.5930×2y^x0+0.2=y^x0+1.1860

The difference of these two predicted values gives the change of the right foot temperature for 2 Fahrenheit change in the temperature of left foot.

  y^x0+10y^x0=1.1860

Conclusion:

Therefore, an increase of 1.1860 Fahrenheit in the temperature of right foot can be expected for a 2 Fahrenheit change of the temperature in left foot.

d.

Expert Solution
Check Mark
To determine

To find: The predicted right foot temperature when the left foot is in 81 degrees of Fahrenheit.

Answer to Problem 25E

The predicted right foot temperature is 97.6483 degrees of Fahrenheit.

Explanation of Solution

Given:

The formula of the least square regression has been determined as y^=49.6153+0.5930x

Calculation:

When the temperature of the left foot is 81 Fahrenheit, the variable x should be assigned as x=81 . By substituting this property into the formula, we can calculate the corresponding y value. This is the predicted right foot temperature.

  y^=49.6153+0.5930×81=49.6153+48.033y^=97.6483

Conclusion:

Therefore, the predicted right foot temperature is 97.6483 degrees.

Want to see more full solutions like this?

Subscribe now to access step-by-step solutions to millions of textbook problems written by subject matter experts!

Chapter 4 Solutions

ELEMENTARY STATISTICS LOOSE+ACCESS COD

Ch. 4.1 - In Exercises 17-20, compute the correlation...Ch. 4.1 - In Exercises 17-20, compute the correlation...Ch. 4.1 - In Exercises 21-24, determine whether the...Ch. 4.1 - In Exercises 21-24, determine whether the...Ch. 4.1 - In Exercises 21-24, determine whether the...Ch. 4.1 - In Exercises 21-24, determine whether the...Ch. 4.1 - In Exercises 25-30, determine whether the...Ch. 4.1 - In Exercises 25-30, determine whether the...Ch. 4.1 - In Exercises 25-30, determine whether the...Ch. 4.1 - In Exercises 25-30, determine whether the...Ch. 4.1 - In Exercises 25-30, determine whether the...Ch. 4.1 - In Exercises 25-30, determine whether the...Ch. 4.1 - Price of eggs and milk: The following table...Ch. 4.1 - Government funding: The following table presents...Ch. 4.1 - Pass the ball: The NFL Scouting Combine is an...Ch. 4.1 - Carbon footprint: Carbon dioxide (co2) is produced...Ch. 4.1 - Prob. 35ECh. 4.1 - Prob. 36ECh. 4.1 - Blood pressure: A blood pressure measurement...Ch. 4.1 - Prob. 38ECh. 4.1 - Police and crime: In a survey of cities in the...Ch. 4.1 - Age and education: A survey of U.S. adults showed...Ch. 4.1 - Whats the correlation? In a sample of adults, the...Ch. 4.1 - Prob. 42ECh. 4.1 - Changing means and standard deviations: A small...Ch. 4.2 - In Exercises 5-7, fill in each blank with the...Ch. 4.2 - In Exercises 5-7, fill in each blank with the...Ch. 4.2 - In Exercises 5-7, fill in each blank with the...Ch. 4.2 - Prob. 8ECh. 4.2 - Prob. 9ECh. 4.2 - Prob. 10ECh. 4.2 - Prob. 11ECh. 4.2 - Prob. 12ECh. 4.2 - In Exercises 13-16, compute the least-squares...Ch. 4.2 - In Exercises 13-16, compute the least-squares...Ch. 4.2 - In Exercises 13-16, compute the least-squares...Ch. 4.2 - In Exercises 13-16, compute the least-squares...Ch. 4.2 - Compute the least-squares regression he for...Ch. 4.2 - Compute the least-squares regression he for...Ch. 4.2 - In a hypothetical study of the relationship...Ch. 4.2 - Assume in a study of educational level in years...Ch. 4.2 - Prices of egg and milk: The following table...Ch. 4.2 - Prob. 22ECh. 4.2 - Pass the ball: The NFL Scouting Combine is an...Ch. 4.2 - Carbon footprint: Carbon dioxide (CO2) is produced...Ch. 4.2 - Foot temperatures: Foot ulcers are a common...Ch. 4.2 - Mortgage payments: The following table presents...Ch. 4.2 - Blood pressure: A blood pressure measurement...Ch. 4.2 - Butterfly wings: Do larger butterflies live...Ch. 4.2 - Interpreting technology: The following display...Ch. 4.2 - Interpreting technology: The following display...Ch. 4.2 - Interpreting technology: The following MINITAB...Ch. 4.2 - Interpreting technology: The following MINITAB...Ch. 4.2 - Prob. 33ECh. 4.2 - Prob. 34ECh. 4.2 - Least-squares regression line for z-scores: The...Ch. 4.3 - In Exercises 5-10, fill in each blank with the...Ch. 4.3 - In Exercises 5-10, fill in each blank with the...Ch. 4.3 - In Exercises 5-10, fill in each blank with the...Ch. 4.3 - In Exercises 5-10, fill in each blank with the...Ch. 4.3 - In Exercises 5-10, fill in each blank with the...Ch. 4.3 - Prob. 10ECh. 4.3 - Prob. 11ECh. 4.3 - In Exercises 11-14, determine whether the...Ch. 4.3 - Prob. 13ECh. 4.3 - In Exercises 11-14, determine whether the...Ch. 4.3 - For the following data set: Compute the...Ch. 4.3 - For the following data set: Compute the...Ch. 4.3 - For the following data set: Compute the...Ch. 4.3 - For the following data set: Compute the...Ch. 4.3 - Prob. 19ECh. 4.3 - Prob. 20ECh. 4.3 - Prob. 21ECh. 4.3 - Prob. 22ECh. 4.3 - Prob. 23ECh. 4.3 - Prob. 24ECh. 4.3 - Mutant genes: In a study to determine whether the...Ch. 4.3 - Imports and exports: The following table presents...Ch. 4.3 - Energy consumption: The following table presents...Ch. 4.3 - Cost of health care: The following table presents...Ch. 4.3 - Prob. 29ECh. 4.3 - Broadway: The following table presents the average...Ch. 4.3 - Prob. 31ECh. 4.3 - Transforming a variable: The following table...Ch. 4.3 - Prob. 33ECh. 4.3 - Prob. 34ECh. 4 - Compute the correlation coefficient for the...Ch. 4 - The number of theaters showing the movie Monsters...Ch. 4 - Use the data in Exercise 2 to compute the...Ch. 4 - A scatterplot has a correlation of r=1. Describe...Ch. 4 - Prob. 5CQCh. 4 - The following table presents the average delay in...Ch. 4 - Use the least-squares regression line computed in...Ch. 4 - Use the least-squares regression line computed in...Ch. 4 - Prob. 9CQCh. 4 - A scatterplot has a least-squares regression line...Ch. 4 - Prob. 11CQCh. 4 - Prob. 12CQCh. 4 - A sample of students was studied to determine the...Ch. 4 - In a scatter-plot; the point (-2, 7) is...Ch. 4 - The correlation coefficient for a data set is...Ch. 4 - Prob. 1RECh. 4 - Prob. 2RECh. 4 - Hows your mileage? Weight (in tons) and fuel...Ch. 4 - Prob. 4RECh. 4 - Energy efficiency: A sample of 10 households was...Ch. 4 - Energy efficiency: Using the data in Exercise 5:...Ch. 4 - Prob. 7RECh. 4 - Prob. 8RECh. 4 - Prob. 9RECh. 4 - Prob. 10RECh. 4 - Baby weights: The average gestational age (time...Ch. 4 - Commute times: Every morning, Tania leaves for...Ch. 4 - Prob. 13RECh. 4 - Prob. 14RECh. 4 - Prob. 15RECh. 4 - Describe an example which two variables are...Ch. 4 - Two variables x and y have a positive association...Ch. 4 - Prob. 3WAICh. 4 - Prob. 4WAICh. 4 - Prob. 5WAICh. 4 - Prob. 6WAICh. 4 - Prob. 7WAICh. 4 - Prob. 8WAICh. 4 - Prob. 9WAICh. 4 - The following table, Reproduce from chapter...Ch. 4 - The following table, Reproduce from chapter...Ch. 4 - The following table. Reproduce from chapter...Ch. 4 - Prob. 4CSCh. 4 - Prob. 5CSCh. 4 - The relationship between inflation and...Ch. 4 - The relationship between inflation and...Ch. 4 - Relationship between inflation and unemployment is...Ch. 4 - Relationship between inflation and unemployment is...Ch. 4 - If we are going to use data from this year to...Ch. 4 - If we are going to use data from this year to...Ch. 4 - Prob. 12CSCh. 4 - Prob. 13CSCh. 4 - Prob. 14CSCh. 4 - Prob. 15CS
Knowledge Booster
Background pattern image
Statistics
Learn more about
Need a deep-dive on the concept behind this application? Look no further. Learn more about this topic, statistics and related others by exploring similar questions and additional content below.
Recommended textbooks for you
Text book image
Elementary Linear Algebra (MindTap Course List)
Algebra
ISBN:9781305658004
Author:Ron Larson
Publisher:Cengage Learning
Text book image
Linear Algebra: A Modern Introduction
Algebra
ISBN:9781285463247
Author:David Poole
Publisher:Cengage Learning
Text book image
Big Ideas Math A Bridge To Success Algebra 1: Stu...
Algebra
ISBN:9781680331141
Author:HOUGHTON MIFFLIN HARCOURT
Publisher:Houghton Mifflin Harcourt
Correlation Vs Regression: Difference Between them with definition & Comparison Chart; Author: Key Differences;https://www.youtube.com/watch?v=Ou2QGSJVd0U;License: Standard YouTube License, CC-BY
Correlation and Regression: Concepts with Illustrative examples; Author: LEARN & APPLY : Lean and Six Sigma;https://www.youtube.com/watch?v=xTpHD5WLuoA;License: Standard YouTube License, CC-BY