
Videos
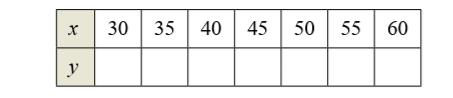
Average Speed A driver’s average speed is 50 miles per hour on a round trip between two cities 100 miles apart. The average speeds for going and returning were
(a) Show that
(b) Determine the vertical and horizontal asymptotes of the graph of the function.
(c) Use a graphing utility to graph the function.
(d) Complete the table.
(e) Are the results in the table what you expected? Explain.
(f ) Is it possible to average 20 miles per hour in one direction and still average 50 miles per
hour on the round trip? Explain.
Want to see the full answer?
Check out a sample textbook solution
Chapter 4 Solutions
College Algebra


- Fluid Flow The intake pipe of a 100-gallon tank has a flow rate of 10 gallons per minute, and two drainpipes have flow rates of 5 gallons per minute each. The figure shows the volume V of fluid in the tank as a function of time t. Determine whether the input pipe and each drainpipe are open or closed in specific subintervals of the 1 hour of time shown in the graph. (There are many correct answers.)arrow_forwardMagazine Circulation: The circulation C of a certain magazine as a function of time t is given by the formula C=5.20.1+0.3t Here C is measured in thousands, and t is measured in years since the beginning of 2006, when the magazine was started. a. Make a graph of C versus t covering the first 6 years of the magazines existence. b. Express using functional notation the circulation of the magazine 18 months after it was started, and then find that value. c. Over what time interval is the graph of C concave up? Explain your answer in practical terms. d. At what time was the circulation increasing the fastest?. e. Determine the limiting value for C. Explain your answer in practical terms.arrow_forwardTemperature An object at a temperature of 160C was removed from a furnace and placed in a room at 20C. The temperature T of the object was measured each hour h and recorded in the table. A model for the data is T=20+140e0.68h. (a) The figure below shows the graph of the model. Use the graph to identify the horizontal asymptote of the model and interpret the asymptote in the context of the problem. (b) Use the model to approximate the time it took for the object to reach a temperature of 100C.arrow_forward
- Temperature An object at a temperature of 160C was removed from a furnace and placed in a room at 20C. The temperature T of the object was measured each hour h and recorded in the table. A model for the data is T=20+140e0.68h (a)The figure below shows the graph of the model. Use the graph to identify the horizontal asymptote of the model and interpret the asymptote in the context of the problem. (b) Use the model to approximate the time it took for the object to reach a temperature of 100C.arrow_forwardLocal Extrema and Asymptotes Draw a graph of the function and use it to determine the asymptotes and the local maximum and minimum values. y=10x5xarrow_forward

 Trigonometry (MindTap Course List)TrigonometryISBN:9781337278461Author:Ron LarsonPublisher:Cengage Learning
 College AlgebraAlgebraISBN:9781305115545Author:James Stewart, Lothar Redlin, Saleem WatsonPublisher:Cengage Learning
 Algebra & Trigonometry with Analytic GeometryAlgebraISBN:9781133382119Author:SwokowskiPublisher:Cengage
 Algebra and Trigonometry (MindTap Course List)AlgebraISBN:9781305071742Author:James Stewart, Lothar Redlin, Saleem WatsonPublisher:Cengage Learning
 College Algebra (MindTap Course List)AlgebraISBN:9781305652231Author:R. David Gustafson, Jeff HughesPublisher:Cengage Learning