
Concept explainers
Videos
For the following exercises, consider the production of gold during the California gold rush (1848-1888). The production of gold can be modeled by
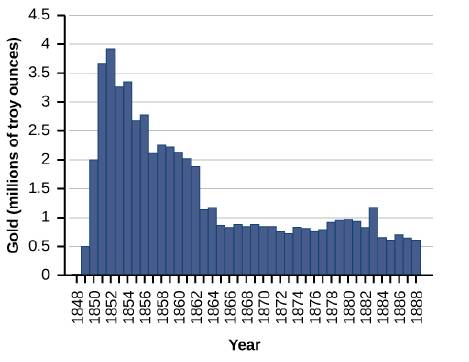
142. Find when the maximum (local and global) gold production occurred, and the amount of gold produced during that maximum.

Trending nowThis is a popular solution!

Chapter 4 Solutions
CALCULUS,VOLUME 1 (OER)
Additional Math Textbook Solutions
Calculus Volume 2
Introductory Statistics
Using & Understanding Mathematics: A Quantitative Reasoning Approach (7th Edition)
Mathematics All Around (6th Edition)
Calculus for Business, Economics, Life Sciences, and Social Sciences (14th Edition)
Thinking Mathematically (7th Edition)


- When a certain drug is taken orally, the concentration of the drug in the patient's bloodstream After t minutes is given by C(t)=0.06t0.0002t2 where 0t240 and concentration is measured in mg/L .When is the maximum serum concentration reached, and what is that maximum concentration?arrow_forwardbThe average rate of change of the linear function f(x)=3x+5 between any two points is ________.arrow_forwardFor the following exercises, use the graph in Figure 8, which shows the profit, y, in thousands of dollars, of a companyin a given year, t, where trepresents the number of years since 1980. 35. Find the linear function y, where y depends on t, the number of years since 1980.arrow_forward
- For the following exercises, consider the graph of f shown in Figure 15. 17.Estimate the average rate of change from x=2tox=5 .arrow_forwardFor the following exercises, use the graph in Figure 3, showing the profit, y, in thousands of dollars, of a company in a given year, x, where x represents years since 1980. In 2004, a school population was 1250. By 2012 the population had dropped to 875. Assume the population is changing linearly. a. How much did the population drop between the year 2004 and 2012? b. What is the average population decline per year? c. Find an equation for the population, P, of the school t years after 2004.arrow_forwardFind the intensities of earthquakes whose magnitudes are (a) R=6.0 and (b) R=7.9.arrow_forward
- Find the average rate of change of f(x)=x2+2x8 on the interval [5,a] in simplest forms in terms ofa.arrow_forwardFor the following exercises, use the graphs to determine the intervals on which the functions are increasing, decreasing, or constant. 31. Find the local extrema for the function graphed in Exercise 28.arrow_forwardFor the following exercises, consider this scenario: A town has an initial population of 75,000. It grows at a constantrate of 2,500 per year for 5 years. Find the linear function that models the town’spopulation P as a function of the year, t, where t isthe number ofyears since the model began.arrow_forward
- For the following exercises, use the graph in Figure 1 showing the profit, y, in thousands ofdollars, of a company ina given year, 1, where x represents years since 1980. 27. Find the linear function y, where y depends on x, the number of years since 1980.arrow_forwardFor the following exercises, evaluate the function f(x)=3x2+2x at the given input. 9. Find the average rate of change of the function f(x)=32x2+x by finding f(b)f(a)ba .arrow_forwardWhat is the composition of two functions, fg ?arrow_forward

 College AlgebraAlgebraISBN:9781305115545Author:James Stewart, Lothar Redlin, Saleem WatsonPublisher:Cengage Learning
 Glencoe Algebra 1, Student Edition, 9780079039897...AlgebraISBN:9780079039897Author:CarterPublisher:McGraw Hill
 Trigonometry (MindTap Course List)TrigonometryISBN:9781337278461Author:Ron LarsonPublisher:Cengage Learning
 Big Ideas Math A Bridge To Success Algebra 1: Stu...AlgebraISBN:9781680331141Author:HOUGHTON MIFFLIN HARCOURTPublisher:Houghton Mifflin Harcourt