
Concept explainers
Videos
Protective Orders. In the article “Judicial Dispositions of Ex-Parte and Domestic Violence Protection Order Hearings: A Comparative Analysis of Victim Requests and Court Authorized Relief” (Journal of Family Violence, Vol. 20, No. 3, pp. 161–170), D. Year-wood looked at the discrepancies between what a victim of domestic violence requests and what the courts reward. The following contingency table cross-classifies, by race and gender, a sample of 407 domestic violence protective orders from the North Carolina Criminal Justice Analysis Center.
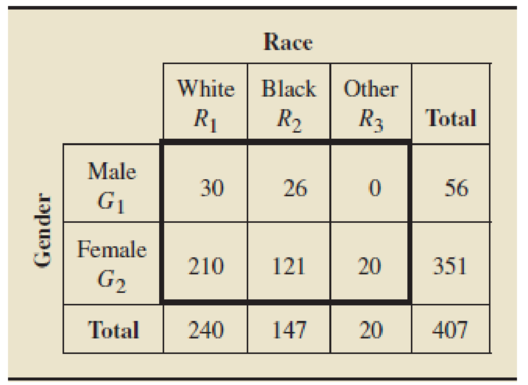
Compute the following conditional probabilities directly; that is, do not use the conditional
- a. a Black.
- b. a white female.
- c. a male, given that the filer was white.
- d. a male, given that the filer was Black.
Want to see the full answer?
Check out a sample textbook solution
Chapter 4 Solutions
Introductory Statistics (10th Edition)
Additional Math Textbook Solutions
The Practice of Statistics for AP - 4th Edition
Elementary Statistics ( 3rd International Edition ) Isbn:9781260092561
Statistics: Informed Decisions Using Data (5th Edition)
Research Methods for the Behavioral Sciences (MindTap Course List)
Applied Statistics in Business and Economics
Introduction to Statistical Quality Control


- Jensen Tire & Auto is in the process of deciding whether to purchase a maintenance contract for its new computer wheel alignment and balancing machine. Managers feel that maintenance expense should be related to usage, and they collected the following information on weekly usage (hours) and annual maintenance expense (in hundreds of dollars). Weekly Usage(hours) AnnualMaintenanceExpense 13 17.0 10 22.0 20 30.0 28 37.0 32 47.0 17 30.5 24 32.5 31 39.0 40 51.5 38 40.0 test statistic is 6.90 Find the p-value. (Round your answer to three decimal places.) p-value = State your conclusion. Reject H0. We conclude that the relationship between weekly usage (hours) and annual maintenance expense (in hundreds of dollars) is significant. Do not reject H0. We conclude that the relationship between weekly usage (hours) and annual maintenance expense (in hundreds of dollars) is significant. Reject H0. We cannot conclude that the relationship between weekly usage…arrow_forwardIn order to estimate the relative abundance and geographic distribution of pheasants in Iowa, the Iowa Department of Natural Resources conducts annual road side surveys of pheasant populations. On the roads bordering five randomly selected farms in one county labeled generically as Farms A, B, C, D, and E, the survey counts were as follows: Farm # Pheasants Road miles A 3 1 B 8 1 C 9 2 D 5 1 E 11 3 One hypothesis about the geographic distribution of organisms, knowns as the spatial randomness hypothesis, asserts, as applied to the pheasant survey, that pheasants are randomly distributed throughout uniform habitat in such a way that the expected number of pheasants along any stretch of road is proportional to the length of that road. The lengths of road traveled along each farm are shown in the rightmost column of the table. Do the counts from the survey support or cast doubt on the spatial randomness hypothesis for pheasants on farmland in this country? Take a = 0.05.arrow_forwardIn the Salsberry (2003) study shared in this weeks module, the researcher presents the following results of the statistical analysis: "With respect to family configuration, 20% of the children enrolled in Medicaid, 29% of the uninsured children, and 44% of the privately insured children were in families where the adults were in a “partnered relationship”, [χ2 (2,N = 392) = 21.95; P = .0001]" What type of analysis does this statement reflect?arrow_forward
- A random sample of companies in electric utilities (I), financial services (II), and food processing (III) gave the following information regarding annual profits per employee (units in thousands of dollars). I II III 49.6 55.7 39.3 43.5 24.7 37.8 32.7 41.9 10.1 27.9 29.1 32.3 38.6 39.1 15.9 36.7 42.9 20.9 Shall we reject or not reject the claim that there is no difference in population mean annual profits per employee in each of the three types of companies? Use a 1% level of significance. (b) Find SSTOT, SSBET, and SSW and check that SSTOT = SSBET + SSW. (Use 3 decimal places.) SSTOT = SSBET = SSW = Find d.f.BET, d.f.W, MSBET, and MSW. (Use 3 decimal places for MSBET, and MSW.) dfBET = dfW = MSBET = MSW = Find the value of the sample F statistic. (Use 3 decimal places.)What are the degrees of freedom? (numerator) (denominator) Make a summary table for your ANOVA test. Source…arrow_forwardConsider the following two hypothetical case-control studies, each studying the relationship between eating bacon and stomach cancer stratified by nationality. Complete question after presentation of studies. STUDY 1 JAPANESE AMERICAN Stomach Cancer No Cancer Stomach Cancer No Cancer Eats Bacon 200 100 300 Eats Bacon 115 265 380 No Bacon 100 200 300 No Bacon 20 200 220 300 300 600 135 465 600 STUDY 2 JAPANESE AMERICAN Stomach Cancer No Cancer Stomach Cancer No Cancer Eats Bacon 200 100 300 Eats Bacon 115 265 380 No Bacon 100 200 300 No Bacon 53 530 583 300 300 600 168 795 963 Fill in the strata-specific (strata by nationality), and crude OR’s for both studies. You must show your work.arrow_forwardConsider the following two hypothetical case-control studies, each studying the relationship between eating bacon and stomach cancer stratified by nationality. Complete question after presentation of studies. STUDY 1 JAPANESE AMERICAN Stomach Cancer No Cancer Stomach Cancer No Cancer Eats Bacon 200 100 300 Eats Bacon 115 265 380 No Bacon 100 200 300 No Bacon 20 200 220 300 300 600 135 465 600 STUDY 2 JAPANESE AMERICAN Stomach Cancer No Cancer Stomach Cancer No Cancer Eats Bacon 200 100 300 Eats Bacon 115 265 380 No Bacon 100 200 300 No Bacon 53 530 583 300 300 600 168 795 963 In study 1, is nationality a confounder of the relationship between eating bacon and stomach cancer? Explain your answer. In study 2, is nationality a…arrow_forward
- A random sample of companies in electric utilities (I), financial services (II), and food processing (III) gave the following information regarding annual profits per employee (units in thousands of dollars). I II III 49.9 55.3 39.3 43.4 25.1 37.1 32.2 41.3 10.9 27.5 29.8 32.5 38.2 39.5 15.4 36.8 42.2 20.1 Shall we reject or not reject the claim that there is no difference in population mean annual profits per employee in each of the three types of companies? Use a 10% level of significance. (a) What is the level of significance? (b) Find SSTOT, SSBET, and SSW and check that SSTOT = SSBET + SSW. (Use 3 decimal places.) SSTOT = ? SSBET = ? SSW = ? Find d.f.BET, d.f.W, MSBET, and MSW. (Use 3 decimal places for MSBET, and MSW.) dfBET = ? dfW = ? MSBET = ? MSW = ? Find the value of the sample F statistic. (Use 3 decimal places.)What are the degrees of freedom??(numerator)?(denominator)(c) Find the P-value of the sample test statistic. (Use…arrow_forwardIn a study conducted by the Department of Environmental Sciences at Virginia Tech, the steel rods supplied by two different companies were compared. Ten sample springs were made out of the steel rods supplied by each company and a measure of flexibility was recorded for each. The data are as follows: Company-A: 6.1 8.2 7.1 7.5 8.1 6.0 8.0 6.5 7.2 7.0 Company-B: 12 9.5 9.9 10.2 10.2 9.7 11.0 11.1 10.2 9.6 a. Calculate the standard deviation for the data of the two companies. b. Which company is better?arrow_forwardA random sample of companies in electric utilities (I), financial services (II), and food processing (III) gave the following information regarding annual profits per employee (units in thousands of dollars). I II III 49.1 55.6 39.0 43.4 25.0 37.3 32.9 41.3 10.8 27.8 29.9 32.5 38.3 39.5 15.8 36.1 42.6 20.2 Shall we reject or not reject the claim that there is no difference in population mean annual profits per employee in each of the three types of companies? Use a 1% level of significance. Find the following: MSbet: MSwit: Fratio: F0.01: Conclusion:arrow_forward
- A report provided an overview of the complaints about airlines received by the Department of Transportation. The table below gives the number of complaints received by type of complaint for the years 2014 and 2015. Type of Complaint 2014 Number ofComplaints Received 2015 Number ofComplaints Received Flight Problems 4,404 5,606 Baggage Handling 1,528 2,050 Reservations, Ticketing, Boarding 1,276 1,807 Customer Service 1,101 1,728 Fares 699 1,300 Other 2,257 2,769 Use the given information to estimate the following probabilities. (Round your answers to three decimal places.) c)the probability that two complaints made in 2015 were both about flight problemsarrow_forwardConsider the following two hypothetical case-control studies, each studying the relationship between eating bacon and stomach cancer stratified by nationality. Complete questions after presentation of studies. STUDY 1 JAPANESE AMERICAN Stomach Cancer No Cancer Stomach Cancer No Cancer Eats Bacon 200 100 300 Eats Bacon 115 265 380 No Bacon 100 200 300 No Bacon 20 200 220 300 300 600 135 465 600 STUDY 2 JAPANESE AMERICAN Stomach Cancer No Cancer Stomach Cancer No Cancer Eats Bacon 200 100 300 Eats Bacon 115 265 380 No Bacon 100 200 300 No Bacon 53 530 583 300 300 600 168 795 963 Is nationality a risk factor for stomach cancer? You may use 2-by-2 tables and calculation of odds ratio to make your assessment. You must show your work.arrow_forwardHow productive are U.S. workers? One way to answer this question is to study annual profits per employee. A random sample of companies in computers (I), aerospace (II), heavy equipment (III), and broadcasting (IV) gave the following data regarding annual profits per employee (units in thousands of dollars). I II III IV 27.2 13.3 22.2 17.3 23.2 9.3 20.1 16.6 14.8 11.8 7.9 14.4 8.2 8.7 12.2 15.1 11.3 6.5 7.7 10.2 19.7 9.8 Shall we reject or not reject the claim that there is no difference in population mean annual profits per employee in each of the four types of companies? Use a 5% level of significance. (b) Find SSTOT, SSBET, and SSW and check that SSTOT = SSBET + SSW. (Use 3 decimal places.) SSTOT = SSBET = SSW = Find d.f.BET, d.f.W, MSBET, and MSW. (Use 3 decimal places for MSBET, and MSW.) dfBET = dfW = MSBET = MSW = (c) Find the value of the sample F statistic. (Use 3 decimal places.) (d) Make a summary table for your…arrow_forward
 Glencoe Algebra 1, Student Edition, 9780079039897...AlgebraISBN:9780079039897Author:CarterPublisher:McGraw Hill