
Videos
Acclaim or Attack. In the article “A
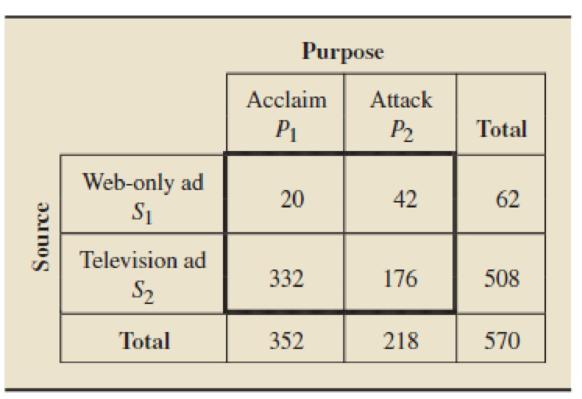
- a. Find P(S2).
- b. Find P(S2 & P1).
- c. Obtain P(P1 | S2) directly from the table.
- d. Obtain P(P1 | S2) by using the conditional probability rule and your answers from parts (a) and (b).
Want to see the full answer?
Check out a sample textbook solution
Chapter 4 Solutions
Introductory Statistics (10th Edition)
Additional Math Textbook Solutions
Statistics for Engineers and Scientists
Applied Statistics in Business and Economics
Elementary Statistics ( 3rd International Edition ) Isbn:9781260092561
Essentials of Statistics, Books a la Carte Edition (5th Edition)


- Urban Travel Times Population of cities and driving times are related, as shown in the accompanying table, which shows the 1960 population N, in thousands, for several cities, together with the average time T, in minutes, sent by residents driving to work. City Population N Driving time T Los Angeles 6489 16.8 Pittsburgh 1804 12.6 Washington 1808 14.3 Hutchinson 38 6.1 Nashville 347 10.8 Tallahassee 48 7.3 An analysis of these data, along with data from 17 other cities in the United States and Canada, led to a power model of average driving time as a function of population. a Construct a power model of driving time in minutes as a function of population measured in thousands b Is average driving time in Pittsburgh more or less than would be expected from its population? c If you wish to move to a smaller city to reduce your average driving time to work by 25, how much smaller should the city be?arrow_forwardThe success of an airline depends heavily on its ability to provide a pleasant customer experience. One dimension of customer service on which airlines compete is on-time arrival. The tables below contains a sample of data from delayed flights showing the number of minutes each delayed flight was late for two different airlines, Company A and Company B. Company A 34 59 43 30 3 32 42 85 30 48 110 50 10 26 70 52 83 78 27 70 27 90 38 52 76 Company B 44 63 43 34 67 104 45 28 38 84 76 45 33 49 63 43 36 34 65 65 (a) Formulate the hypotheses that can be used to test for a difference between the population mean minutes late for delayed flights by these two airlines. (Let ?1 = population mean minutes late for delayed Company A flights and ?2 = population mean minutes late for delayed Company B flights.) H0: ?1 − ?2 ≥ 0 Ha: ?1 − ?2 < 0 H0: ?1 − ?2 < 0 Ha: ?1 − ?2 = 0 H0: ?1 − ?2 ≠ 0 Ha: ?1 − ?2 = 0 H0: ?1 − ?2 = 0 Ha: ?1 − ?2 ≠ 0 H0: ?1 − ?2 ≤…arrow_forwardThe success of an airline depends heavily on its ability to provide a pleasant customer experience. One dimension of customer service on which airlines compete is on-time arrival. The tables below contains a sample of data from delayed flights showing the number of minutes each delayed flight was late for two different airlines, Company A and Company B. Company A 34 59 43 30 3 32 42 85 30 48 110 50 10 26 70 52 83 78 27 70 27 90 38 52 76 Company B 46 65 42 33 67 105 44 28 37 86 74 44 33 50 62 43 34 34 65 65 (a)Formulate the hypotheses that can be used to test for a difference between the population mean minutes late for delayed flights by these two airlines. (Let ?1 = population mean minutes late for delayed Company A flights and ?2 = population mean minutes late for delayed Company B flights.) H0: ?1 − ?2 = 0 Ha: ?1 − ?2 ≠ 0 H0: ?1 − ?2 < 0 Ha: ?1 − ?2 = 0 H0: ?1 − ?2 ≤ 0 Ha: ?1 − ?2 > 0 H0: ?1 − ?2 ≥ 0 Ha: ?1 − ?2 < 0 H0: ?1 − ?2…arrow_forward
- The Behavioral Risk Factor Surveillance System (BRFSS) is an annual telephone survey designed to identify risk factors in the adult population and reportemerging health trends. The following table summarizes two variables for the respondents: health status and health coverage, which describes whether each respondent had health insurance: Health Status Excellent Very Good Good Fair Poor Total Health No 459 727 854 385 99 2524 Coverage Yes 4198 6245 4821 1634 578 17476 Total 4657 6972 5675 2019 677 20000 If we draw one individual at random, what is the probability that the respondent has health coverage if they have good health? Answer with a decimal rounded to 3 decimal places.arrow_forwardReference: Camm J.D. et al., (2019) Business Analytics: descriptive, predictive and prescriptive (3rd edition). Cengage ____________________________________________________________________________________ Jay Gatsby categorizes wines into one of three clusters. The centroids of these clusters, describing the average characteristics of a wine in each cluster, are listed in the following table. Characteristic Cluster 1 Cluster 2 Cluster 3 Alcohol 0.819 0.164 -0.937 MalicAcid -0.329 0.869 -0.368 Ash 0.248 0.186 -0.393 Alcalinity…arrow_forward6. In the book Business Research Methods (5th ed.), Donald R. Cooper and C. William Emory discuss studying the relationship between on-the-job accidents and smoking. Cooper and Emory describe the study as follows: Suppose a manager implementing a smoke-free workplace policy is interested in whether smoking affects worker accidents. Since the company has complete reports of on-the-job accidents, she draws a sample of names of workers who were involved in accidents during the last year. A similar sample from among workers who had no reported accidents in the last year is drawn. She interviews members of both groups to determine if they are smokers or not. The sample results are given in the following table.arrow_forward
- The owner of a restaurant in Bloomington, Indianna, has recorded sales data for the past 10 years. He has also recorded data on potentially relevant variables. The following table gives data on sales and other potentially relevant variables for that particular restaurant. Sales (thousands of dollars) Year Population Advertising (thousands of dollars) Previous advertising (thousands of dollars) $15713 1 102558 $20 $30 $12937 2 101792 $15 $20 $12872 3 104347 $25 $15 $16227 4 106180 $30 $25 $15388 5 106562 $15 $30 $13180 6 105209 $25 $15 $17199 7 109185 $35 $25 $20674 8 109976 $40 $35 $20350 9 110659 $20 $40 $14444 10 111844 $25 $20 Consider the model: salest = 0 + 1t + 2popt + 3advt + 4advt-1 + t where salest = sales in year t, popt = size of the population residing within 10 kilometres of the restaurant, advt =…arrow_forwardThe article ``Work-Related Attitudes" (Psychological Reports, 1991:443-450) reports the results of a survey of 395 elementary school teachers and 266 high school teachers. Of the elementary school teachers, 224 said they were very satisfied with their jobs, whereas 126 of the high school high school teachers were very satisfied with their jobs. Consider the elementary school teachers and the high school teachers that were interviewed as two independent groups. Test the claim that the proportion of elementary teachers who are satisfied (p1) is LARGER THAN the proportion of high school teachers who are satisfied (p2), using α=0.05.arrow_forwardEcologists conducted a study to investigate the potential ecological impact of golf courses. Investigators monitored the reproductive success of bluebirds in birdhouses at nine golf courses and ten similar birdhouses at nongolf sites. Data on nests in birdhouses occupied only by bluebirds are shown in the table. Observed Number of Nests per Birdhouse by Location 0 nests 1 nest 2 or 3 nests Total Golf 30 42 8 80 Nongolf 40 58 22 120 Total 70 100 30 200 40 A 42 B 50 C 58 D 60 Earrow_forward
- An automotive engineer is investigating two different types of metering devices for an electronic fuel injection system to determine whether they differ in their fuel mileage performance. The system is installed on 10 different cars, and a test is run with each metering device on each car. The data is provided below: Metering Device Car 1 2 1 17.6 16.8 2 19.4 20.0 3 18.2 17.6 4 17.1 16.4 5 15.3 16.0 6 15.9 15.9 7 16.3 16.5 8 18.0 18.4 9 17.3 16.4 10 19.1 20.1 Is there a significant difference between the means of the two metering devices? Use . Interpret the result in the context of the problem. An article in the journal Hazardous Waste and Hazardous Materials (Vol. 6, 1989) reported the results of an analysis of the weight of calcium in standard cement and cement doped with lead. Reduced levels of calcium would indicate that the hydration mechanism in the cement is blocked…arrow_forwardA research group is interested in the relationship between exposure to mold in households after a major hurricane and the onset of acute respiratory illness in children. Suppose an observational study is conducted over 10 years following the natural disaster and the following two-by-two table was created in order to address the relationship between exposure and outcome. Acute Respiratory Illness No Acute Respiratory Illness Total Mold 378 156 534 No Mold 73 260 333 Total 451 416 867 Calculate the incidence of acute respiratory illness in the exposed and unexposed. Calculate the relative risk for ARI due to exposure in this study Interpret your findings from part Barrow_forwardA paper investigated the driving behavior of teenagers by observing their vehicles as they left a high school parking lot and then again at a site approximately 1 2 mile from the school. Assume that it is reasonable to regard the teen drivers in this study as representative of the population of teen drivers. MaleDriver FemaleDriver 1.4 -0.2 1.2 0.5 0.9 1.1 2.1 0.7 0.7 1.1 1.3 1.2 3 0.1 1.3 0.9 0.6 0.5 2.1 0.5 (a) Use a .01 level of significance for any hypothesis tests. Data consistent with summary quantities appearing in the paper are given in the table. The measurements represent the difference between the observed vehicle speed and the posted speed limit (in miles per hour) for a sample of male teenage drivers and a sample of female teenage drivers. (Use ?males − ?females. Round your test statistic to two decimal places. Round your degrees of freedom down to the nearest whole number. Round your p-value to three decimal places.) t = df =…arrow_forward
 Functions and Change: A Modeling Approach to Coll...AlgebraISBN:9781337111348Author:Bruce Crauder, Benny Evans, Alan NoellPublisher:Cengage Learning
 Big Ideas Math A Bridge To Success Algebra 1: Stu...AlgebraISBN:9781680331141Author:HOUGHTON MIFFLIN HARCOURTPublisher:Houghton Mifflin Harcourt