
Financial Reporting, Financial Statement Analysis and Valuation
8th Edition
ISBN: 9781285190907
Author: James M. Wahlen, Stephen P. Baginski, Mark Bradshaw
Publisher: Cengage Learning
expand_more
expand_more
format_list_bulleted
Videos
Textbook Question
Chapter 5, Problem 13PC
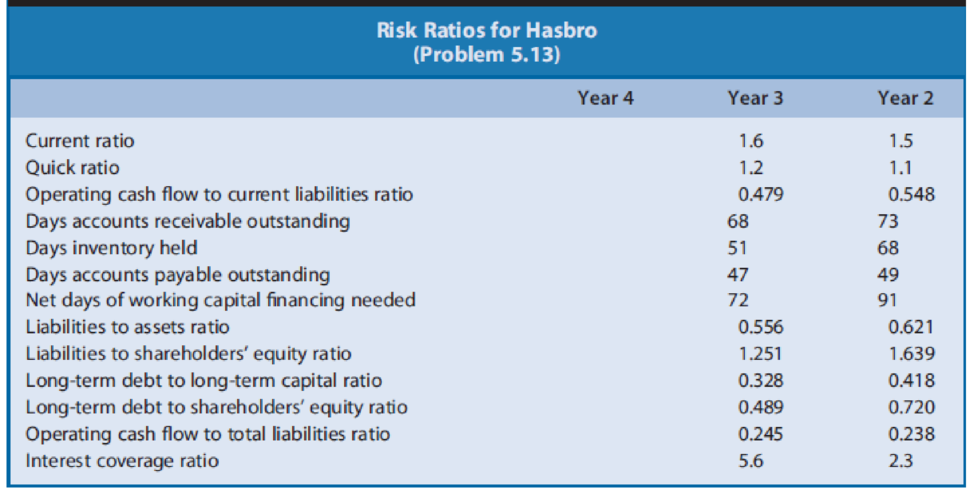
Calculating and Interpreting Risk Ratios. Refer to the financial statement data for Hasbro in Problem 4.24 in Chapter 4. Exhibit 5.15 presents risk ratios for Hasbro for Year 2 and Year 3.
Exhibit 5.15
REQUIRED
- a. Calculate the amounts of these ratios for Year 4.
- b. Assess the changes in the short-term liquidity risk of Hasbro between Year 2 and Year 4 and the level of that risk at the end of Year 4.
- c. Assess the changes in the long-term solvency risk of Hasbro between Year 2 and Year 4 and the level of that risk at the end of Year 4.
Expert Solution & Answer

Trending nowThis is a popular solution!

Students have asked these similar questions
Which of the following is the correct explanation for the purpose of financial risk ratios?
Select one:
a. They show the relative levels of liquid assets of the company.
b. They show the relative proportion of debt items with respect to shareholders' equity or total capital.
c. They show the profitability of the company over a specific period of time.
d. They show the probability of whether the company will face problems in operations.
Using the following data for Jackson Products Company, answer Parts a through g:
Evaluate the liquidity position of Jackson relative to that of the average firm in theindustry. Consider the current ratio, the quick ratio, and the net working capital (currentassets minus current liabilities) for Jackson. What problems, if any, are suggested by thisanalysis?b) Evaluate Jackson’s performance by looking at key asset management ratios. Are anyproblem apparent from this analysis?c) Evaluate the financial risk of Jackson by examining its times interest earned ratio and itsequity multiplier ratio relative to the same industry average ratios.d) Evaluate the profitability of Jackson relative to that of the average firm in its industry,.e) Give an overall evaluation of the performance of Jackson relative to other firms in itsindustry.f) Perform a DuPont analysis for Jackson. What areas appear to have the greatest need forimprovement?g) Jackson’s current P/E ratio is 7 times. What factor(s) are…
Which of the following is the correct explanation for the purpose of financial risk ratios?
Select one:
a. They show the probability of whether the company will face problems in operations.
b. They show the profitability of the company over a specific period of time.
c. They show the relative proportion of debt items with respect to shareholders' equity or total capital.
d. They show the relative levels of liquid assets of the company.
According to the information given in the table below, which of the following is Raw materials consumed?
Opening Stock Raw Materials 32300
Purchases 128800
Freight in 4950
Sales return 2350
Wages paid to labor 78900
Closing Stock Raw Materials 28400
Select one:
a. 135300
b. 149900
c. 143700
d. 137650
d. Current ratio
Chapter 5 Solutions
Financial Reporting, Financial Statement Analysis and Valuation
Ch. 5 - Prob. 1QECh. 5 - Prob. 2QECh. 5 - A firm has experienced an increasing current ratio...Ch. 5 - A firm has experienced a decrease in its current...Ch. 5 - Prob. 5QECh. 5 - A firm had the following values for the four debt...Ch. 5 - Prob. 7QECh. 5 - Prob. 8QECh. 5 - Prob. 9QECh. 5 - Prob. 10QE
Ch. 5 - Market equity beta measures the covariability of a...Ch. 5 - Altmans bankruptcy risk model utilizes the values...Ch. 5 - Calculating and Interpreting Risk Ratios. Refer to...Ch. 5 - Refer to the financial state-ment data for...Ch. 5 - Refer to the profitability ratios of Coca-Cola in...Ch. 5 - Delta Air Lines, Inc., is one of the largest...Ch. 5 - Prob. 17PCCh. 5 - Prob. 18PCCh. 5 - Prob. 19PCCh. 5 - Prob. 20PCCh. 5 - Prob. 21PCCh. 5 - Prob. 22PCCh. 5 - Compute the values of each of the ratios in...
Knowledge Booster


Learn more about
Need a deep-dive on the concept behind this application? Look no further. Learn more about this topic, finance and related others by exploring similar questions and additional content below.Similar questions
- Refer to the financial state-ment data for Abercrombie Fitch in Problem 4.25 in Chapter 4. Exhibit 5.16 presents risk ratios for Abercrombie Fitch for fiscal Year 3 and Year 4. Exhibit 5.16 REQUIRED a. Compute the amounts of these ratios for fiscal Year 5. b. Assess the changes in the short-term liquidity risk of Abercrombie Fitch between fiscal Year 3 and fiscal Year 5 and the level of that risk at the end of fiscal Year 5. c. Assess the changes in the long-term solvency risk of Abercrombie Fitch between fiscal Year 3 and fiscal Year 5 and the level of that risk at the end of fiscal Year 5.arrow_forwardDetermine whether each of the following changes in risk ratios is good news or bad news about a company.a. Increase in receivables turnover.b. Decrease in inventory turnover.c. Increase in the current ratio.d. Increase in the debt to equity ratio.arrow_forwardWhich of the following statements are false? Select all that apply a. Liquidity ratios are used to measure the speed with which various accounts are converted into sales. b. When ratios of different years are being compared, inflation should be taken into consideration c. Return on total assets (ROA) is sometimes called return on investment d. Generally, inventory is concerned with the most liquid asset that a firm possesses. e. A P/E ratio of 20 indicates that investors are willing to pay $20 for each $1 of earnings.arrow_forward
- Calculate the projected debt ratio, debt-to-equity ratio, liabilities-to-assets ratio, times-interest-earned ratio, and EBITDA coverage ratios. How does Computron compare with the industry with respect to financial leverage? What can you conclude from these ratios?arrow_forwardThe scatter chart in the following figure was created using sample data for profits and market capitalizations from a sample of firms in the Fortune 500. a. Discuss what the scatter chart indicates about the relationship between profits and market capitalization? b. The data used to produce this are contained in the file Fortune500. Calculate the covariance between profits and market capitalization. Discuss what the covariance indicates about the relationship between profits and market capitalization? c. Calculate the correlation coefficient between profits and market capitalization. What does the correlations coefficient indicate about the relationship between profits and market capitalization?arrow_forwardUse the extended DuPont equation to provide a breakdown of Computrons projected return on equity. How does the projection compare with the previous years and with the industrys DuPont equation?arrow_forward
- Calculate the 2019 debt ratio, liabilities-to-assets ratio, times-interest-earned ratio, and EBITDA coverage ratios. How does Computron compare with the industry with respect to financial leverage? What can you conclude from these ratios?arrow_forwarddiscuss the meaning of liquidity and solvency as it applies to a company's liquidity and credit-risk. It is often thought that the higher the company's current ratio and/or the lower the debt-to-asset ratio, the better the company's financial condition. Do you agree with these statements? Select from industry examples noted below to support/explain your point of view Industry Company Current Ratio Debt-Asset Ratio Oil & Gas Industry Average 2020 1.08 .52 Exxon .80 .51 Marathon Oil 1.32 .41 BP America 11.01 .66arrow_forwardJustify the historic ranking of returns for the following three categories of investment, listed from highest to lowest return: common stocks, long-term Treasury bonds, and Treasury bills.arrow_forward
- In a CAPM world, what do you need to know in order to estimate an asset's expected return? Group of answer choices The risk free rate, the market risk premium, and the asset's standard deviation The risk free rate, the market risk premium, and the asset's beta The corporate bond rate, the expected return on the S&P 500 and the asset's Beta Market sentiment, historical stock returns and the risk free ratearrow_forwardIn historical data, we see that investments with the highest average annual returns also tend to have the highest standard deviations of annual returns. This observation supports the notion that there is a positive correlation between risk and return. Which of the following answers correctly ranks investments from highest to lowest risk (and return), where the security with the highest risk is shown first, the one with the lowest risk last? a. Large-company stocks, small-company stocks, long-term corporate bonds, U.S. Treasury bills, long-term government bonds. b. Small-company stocks, large-company stocks, long-term corporate bonds, long-term government bonds, U.S. Treasury bills. c. U.S. Treasury bills, long-term government bonds, long-term corporate bonds, small-company stocks, large-company stocks. d. Large-company stocks, small-company stocks, long-term corporate bonds, long-term government bonds, U.S. Treasury bills. e. Small-company stocks, long-term corporate bonds,…arrow_forwardThe main ratio used by many financial analysts to examine a company's short-term liquidity risk is the current ratio. However, there are a number of problems that arise when this ratio is used to examine short-term liquidity risk that may make the current ratio less useful than initially thought. Discuss the interpretative problems of using the current ratio.arrow_forward
arrow_back_ios
SEE MORE QUESTIONS
arrow_forward_ios
Recommended textbooks for you
 Financial Reporting, Financial Statement Analysis...FinanceISBN:9781285190907Author:James M. Wahlen, Stephen P. Baginski, Mark BradshawPublisher:Cengage Learning
 Auditing: A Risk Based-Approach (MindTap Course L...AccountingISBN:9781337619455Author:Karla M Johnstone, Audrey A. Gramling, Larry E. RittenbergPublisher:Cengage Learning
 Intermediate Financial Management (MindTap Course...FinanceISBN:9781337395083Author:Eugene F. Brigham, Phillip R. DavesPublisher:Cengage Learning
 Essentials of Business Analytics (MindTap Course ...StatisticsISBN:9781305627734Author:Jeffrey D. Camm, James J. Cochran, Michael J. Fry, Jeffrey W. Ohlmann, David R. AndersonPublisher:Cengage Learning
 Auditing: A Risk Based-Approach to Conducting a Q...AccountingISBN:9781305080577Author:Karla M Johnstone, Audrey A. Gramling, Larry E. RittenbergPublisher:South-Western College Pub
Financial Reporting, Financial Statement Analysis...
Finance
ISBN:9781285190907
Author:James M. Wahlen, Stephen P. Baginski, Mark Bradshaw
Publisher:Cengage Learning
Auditing: A Risk Based-Approach (MindTap Course L...
Accounting
ISBN:9781337619455
Author:Karla M Johnstone, Audrey A. Gramling, Larry E. Rittenberg
Publisher:Cengage Learning
Intermediate Financial Management (MindTap Course...
Finance
ISBN:9781337395083
Author:Eugene F. Brigham, Phillip R. Daves
Publisher:Cengage Learning
Essentials of Business Analytics (MindTap Course ...
Statistics
ISBN:9781305627734
Author:Jeffrey D. Camm, James J. Cochran, Michael J. Fry, Jeffrey W. Ohlmann, David R. Anderson
Publisher:Cengage Learning
Auditing: A Risk Based-Approach to Conducting a Q...
Accounting
ISBN:9781305080577
Author:Karla M Johnstone, Audrey A. Gramling, Larry E. Rittenberg
Publisher:South-Western College Pub
Financial ratio analysis; Author: The Finance Storyteller;https://www.youtube.com/watch?v=MTq7HuvoGck;License: Standard Youtube License