
Videos
Estimating Cost Behavior Using Least-Squares Regression and High-Low Method
Tempt Office Services and Supplies (TOSS) provides various products and services in the Tempt Research Park, home to numerous high-tech and bio-tech companies. Making color copies is one of its most popular and profitable services. The controller performed a regression analysis of data from the Color Copy Department with the following results:
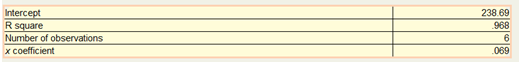
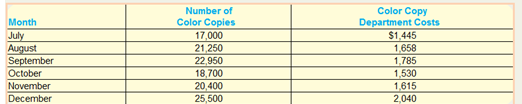
The regression output was based on the following data:
1. What is the variable cost per color copy for TOSS?
2. What is the used cost for the Color Copy Department?
3. Based on the regression output obtained by the controller, what cost formula should be used to estimate future total costs for the Color Copy Department?
4. How accurate will the cost formula developed in requirement 3 be at predicting the total cost for the Color Copy Department?
5. Use the high-low method to estimate the variable and fixed costs for the Color Copy Department. What cost formula should be used based on your analysis?
6. If 22,100 copies are made during January, what is the total cost predicted by each method?
Want to see the full answer?
Check out a sample textbook solution
Chapter 5 Solutions
MANAGERIAL ACCOUNTING W/CONNECT


- Using the data in P4-2 and Microsoft Excel: 1. Separate the variable and fixed elements. 2. Determine the cost to be charged to the product for the year. 3. Determine the cost to be charged to factory overhead for the year. 4. Determine the plotted data points using Chart Wizard. 5. Determine R2. 6. How do these solutions compare to the solutions in P4-2 and P4-3? 7. What does R2 tell you about this cost model?arrow_forwardScattergraph method Using the data in P4-2 and a piece of graph paper: 1. Plot the data points on the graph and draw a line by visual inspection, indicating the trend shown by the data points. 2. Determine the variable cost per unit and the total fixed cost from the information on the graph. 3. Determine the variable cost to be charged to the product for the year. 4. Determine the fixed cost to be charged to factory overhead for the year. 5. Do these answers agree with the answers to P4-2? Why or why not?arrow_forwardTempe Office Services and Supplies (TOSS) provides various products and services in the Tempe Research Park, home to numerous high-tech and bio-tech companies. Making color copies is one of its most popular and profitable services. The controller performed a regression analysis of data from the Color Copy Department with the following results: Intercept R-squared Number of observations X coefficient Month July August September October November December The regression output was based on the following data: Color Copy Department Costs Number of Color Copies 25,900 23,000 19,550 18, 150 30.874686 0.970922 22,150 20,400 6 0.081144 $ 2,095 1,955 1,600 1,475 1,815 1,725 Required: 1. What is the variable cost per color copy for TOSS? 2. What is the fixed cost for the Color Copy Department? 3. Based on the regression output obtained by the controller, what cost formula should be used to estimate future total costs for the Color Copy Department? Enter answer as an equation in the form of y= a…arrow_forward
- Tempe Office Services and Supplies (TOSS) provides various products and services in the Tempe Research Park, home to numerous high-tech and bio-tech companies. Making color copies is one of its most popular and profitable services. The controller performed a regression analysis of data from the Color Copy Department with the following results: Intercept R-squared Number of observations X coefficient Month July August September October November December The regression output was based on the following data: Color Copy Department Costs Number of Color Copies 25,900 23,000 Reg 1 19,550 18,150 22,150 20,400 Regression High-Low Req 2 $ 30.874686 0.970922 Required: 1. What is the variable cost per color copy for TOSS? 2. What is the fixed cost for the Color Copy Department? 3. Based on the regression output obtained by the controller, what cost formula should be used to estimate future total costs for the Color Copy Department? Enter answer as an equation in the form of y= a + bx. 5-a. Use…arrow_forwardThe managerial accountant at Organic Beverage Factory used spreadsheet software to run a regression analysis scenario and compile the following monthly cost data: Organic Beverage Factory Intercept coefficient X Variable 1 Coefficient $4,286,652 $28.21 R-square 0.6521 Which of the following is the correct cost equation showing the correlation of monthly costs, based on the results of the regression analysis compiled by the managerial accountant? O A. y $4,286,652 $28.21 O B. y $0.6521 $28.21x O C. y $28.21x + $4,286,652 O D. y 0.6521x + $4,286,652arrow_forwardWhat I Know Before we begin this lesson, let us check first your prior knowledge on this module. After taking and checking this short test, take note of the items that you are not able to answer correctly and look for the right answer as you go through this module. Direction: Encircle the letter of the correct answer. 1. What type of cost includes product ingredients and materials? а. fixed b. revenue с. total d. variable 2. What type of cost includes the rental of space? а. fixed b. revenue c. total d. variable 3. What type of cost is the product of the price and the quantity sold? а. fixed b. revenue с. total d. variable 4. What concept is being described when the business will neither earn a profit nor suffer a loss? а. break-even b. loss с. profit d. summit 5. What type of analysis shows equal revenue and total cost? а. break-even b. cost of variable c. profit-loss d. volume of salesarrow_forward
- The Connors Company has assembled the following data pertaining to certain costs that cannot beeasily identified as either fixed or variable. Connors Company has heard about a method of measuringcost functions called the high-low method and has decided to use it in this situation.A company has heard about a method of measuring cost functions called the regression analysis and hasdecided to use it in this situation.Cost Hours$23,000 5,000$26,000 6,450$34,600 7,650$42,000 10,000$38,000 9,350What is the estimated total cost at an operating level of 9,000 hours?A) $34,200B) $38,200C) $41,400D) $37,800 Work question #7 using regression analysisarrow_forwardThe graphs below represent cost behavior patterns that might occur in acompany's cost structure. The vertical axis represents total cost, and thehorizontal axis represents activity output. Required:For each of the following situations, choose the graph from the group a-1 that best illustrates the cost pattern involved. Also, for each situation,identify the driver that measures activity output. 1. The cost of power when a fixed fee of $500 per month is chargedplus an additional charge of $0.12 per kilowatt-hour used2. Commissions paid to sales representatives. Commissions arepaid at the rate of 5 percent of sales made up to total annual salesof $500,000, and 7 percent of sales above $500,000.3. A part purchased from an outside supplier costs $12 per part for the first 3,000 parts and $10 per part for all parts purchased inexcess of 3,000 units.4. The cost of surgical gloves, which are purchased in incrementsof 100 units (gloves come in boxes of 100 pairs).5. The cost of tuition at a…arrow_forwardEthan Manufacturing Incorporated produces floor mats for automobiles. The owner, Joseph Ethan, has asked you to assist in estimating maintenance costs. Together, you and Joseph determine that the single best cost driver for maintenance costs is machine hours. These data are from the previous fiscal year for maintenance costs and machine hours: 1. What is the cost equation for maintenance costs using the high-low method? 2. Calculate the mean absolute percentage error (MAPE) for the cost equation you developed in requirement 1. Month Maintenance Costs Machine Hours 1 $ 2,660 1,750 2 2,820 1,830 3 2,970 1,910 4 3,080 1,930 5 3,160 1,960 6 3,130 1,940 7 3,070 1,920 8 2,910 1,900 9 2,680 1,760 10 2,280 1,160 11 2,290 1,360 12 2,510 1,650arrow_forward
- 1. You have been provided with the following data regarding shipments and costs for Brighton Boutiques: Number of Shipments Received Cost per Receiving Report $202 185 120 105 70 80 87 115 100 $300 $200 $100 $- 0 142 154 20 162 Required: Plot the data points on a scatter graph, and then using the high-low method, determine the cost function of the line that will connect the high and low points on the graph. Does the cost function appear to be linear in nature? 200 175 Graph Template 40 80 60 Number of Shipments 100 120 140arrow_forwardOn the Data Tables - Student tab in your Excel spreadsheet, update the given information section of the Income Statement for Hello Company with the data below: Units Price per unit Variable expense per unit Total Fixed Costs Income Statement SCENARIO 1 Product A Product B Product C Required: 2. Using the Data Table What-if Analysis tool in Excel, determine the Units and Operating Income (Loss) for each product based on the following scenarios. (Hint: Don't forget that the warehouse can only hold up to 45,000 units.) Scenario 1: Pete wants to find the mix of units that will result in the highest overall Operating Income, perform this analysis using a two variable data table. Product A can vary between 32,000 units and a maximum of 37.000 units. Product B can vary between 5,000 units and a maximum of 10,000 units. Both Products A and B are manufactured in 1,000-unit increments. The production level of Product C is the same each month at 3,000 units. SCENARIO 2 Product A Product B Product…arrow_forwardGreen Shade manufactures insulated windows. The firm’s repair and maintenance (R&M) cost is mixed and varies most directly with machine hours worked. The following data (on the attached picture) have been gathered from recent operations: a. Use the high–low method to estimate a cost formula for repairs and maintenance. b. Use least squares regression to estimate a cost formula for repairs and maintenance. c. Does the answer to part (a) or to part (b) provide the better estimate of the relation ship between repairs and maintenance costs and machine hours? Why?arrow_forward
 Cornerstones of Cost Management (Cornerstones Ser...AccountingISBN:9781305970663Author:Don R. Hansen, Maryanne M. MowenPublisher:Cengage Learning
 Principles of Cost AccountingAccountingISBN:9781305087408Author:Edward J. Vanderbeck, Maria R. MitchellPublisher:Cengage Learning
 Principles of Accounting Volume 2AccountingISBN:9781947172609Author:OpenStaxPublisher:OpenStax College