
Concept explainers
Videos
Compute equivalent units in second department (Learning Objectives 2 & 5)
Refer to the Arctic Springs Bottling Department Data Set.
- 1. Draw a time line.
- 2. Complete the first two steps of the
process costing procedure for the Bottling Department: summarize the physical flow of units and then compute the equivalent units of direct materials and conversion costs.
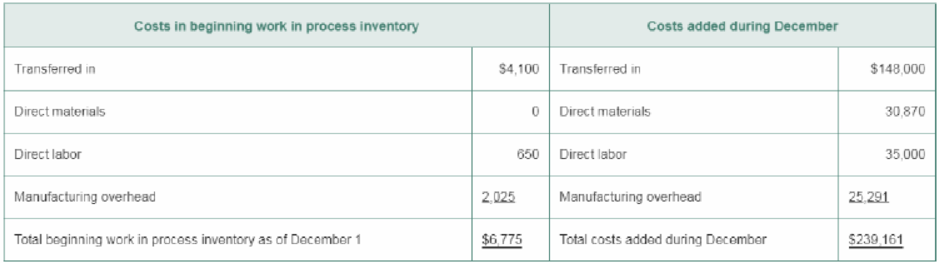
Arctic Springs Data Set: Bottling Department
Arctic Springs produces premium bottled water. The preceding Short Exercises considered the first process in bottling premium water— Filtration. We now consider Arctic Springs’ second process—Bottling. In the Bottling Department, workers bottle the filtered water and pack the bottles into boxes. Conversion costs are incurred evenly throughout the Bottling process, but packaging materials are not added until the end of the process.
December data from the Bottling Department follow:
| Beginning work in process inventory (45% of the way through the process) | 9,000 liters |
| Transferred in from Filtration | 160,000 liters |
| Completed and transferred out to Finished Goods Inventory in December | 147,000 liters |
| Ending work in process inventory (85% of the way through the bottling process) | 22,000 liters |
The Filtration Department completed and transferred out 160,000 liters at a total cost of $148,000.
Want to see the full answer?
Check out a sample textbook solution
Chapter 5 Solutions
Managerial Accounting (5th Edition)


- Calculate a job cost using ABC (Learning Objective 2)Oliver Industries, a small, family-run manufacturer, has adopted an ABC system . The fol- lowing manufacturing activities, indirect manufacturing costs, and usage of cost drivers have been estimated for the year :54-7Direct materials ................................................................................ ? Direct labor ...................................................................................... ? Manufacturing overhead ...... .......... .......... ............. ................. .......... ? Total job cost .................................................................................... $?Classifying costs within the cost hierarchy (Learning Objective 2) Classify each of the following costs as either unit-level, batch-level, product-level, orfacility-level.a. Engineering costs for new productb. Order processingc. Depreciation on factoryd. Direct labore. Shipment of an order to a customerf. Product line manager…arrow_forwardThe cutting department of Legacy Production Company started 40,000 units of specialized chairs during the month of March. The department incurred $15,000 in direct material costs; 2,500 direct labor hours paid at $10 per hour; and manufacturing overhead applied at 150% of direct labor cost. Legacy Production Company uses process costing to accumulate costs. NOTE: There was no beginning inventory in March. Required (Excel Template downloadProvided): (Module Learning Outcomes LO5.1 through LO5.5 AND Course Learning Outcome #1 & #2) Calculate the conversion costs incurred during the month of March (show your calculations). Assume, that only 30,000 units were completed and transferred out. The remaining units left in ending inventroy are only 70% complete with respect to conversion costs. Direct materials are added at the beginning of the process. Prepare a Cutting Department cost production report for the month of March Refer to the cost production report in part b. What are…arrow_forwardAverage labor cost for the first 700 units of a product is RO 50 and the average labor cost of first 1400 units is RO 45. Average time per unit is 100 minutes. The learning ratio and the average labour cost for first 2800 units will be: a. 80% and RO 36.000 b. 90% and RO 40.500 c. 85% and RO 38.250 d. 95% and RO 42.750arrow_forward
- MANAGEMENT ACCOUNTING & CONTROL STANDARD COSTS AND VARIANCE ANALYSIS LEARNING ACTIVITY 1 Torres Company has established standard costs for the cabinet department, in which one size of MX cabinet is made. The standard costs of producing one of these MX cabinets are shown below: Standard Cost Card – MX Cabinet Direct Material: Lumber 50 board ft at P 4 200 Direct Labor: 8 hours at P 10 80 Overhead Costs: Variable – 8 hrs at P5 40 Fixed – 8 hrs at P3 24 Total Standard Unit Cost 344 During June 2018, 500 of these cabinets were produced. The cost of operations during the month are shown below. There is no work in process at the beginning and end of the month. Direct material purchased: 30,000 bf at P4.10 123,000 Direct materials used: 24,000 board ft Direct labor: 4,200 hrs at P9.50 39,900 Overhead Costs : Variable Costs 22,000 Fixed Costs 11,000…arrow_forwardJoseph Fox, controller of Thorpe Company, has been in charge of a project to install an activity-based cost management system. This new system is designed to support the companys efforts to become more competitive. For the past six weeks, he and the project committee members have been identifying and defining activities, associating workers with activities, and assessing the time and resources consumed by individual activities. Now, he and the project committee are focusing on three additional implementation issues: (1) identifying activity drivers, (2) assessing value content, and (3) identifying cost drivers (root causes). Joseph has assigned a committee member the responsibilities of assessing the value content of five activities, choosing a suitable activity driver for each activity, and identifying the possible root causes of the activities. Following are the five activities with possible activity drivers: The committee member ran a regression analysis for each potential activity driver, using the method of least squares to estimate the variable and fixed cost components. In all five cases, costs were highly correlated with the potential drivers. Thus, all drivers appeared to be good candidates for assigning costs to products. The company plans to reward production managers for reducing product costs. Required: 1. What is the difference between an activity driver and a cost driver? In answering the question, describe the purpose of each type of driver. 2. For each activity, assess the value content and classify each activity as value-added or non-value-added (justify the classification). Identify some possible root causes of each activity, and describe how this knowledge can be used to improve activity performance. For purposes of discussion, assume that the value-added activities are not performed with perfect efficiency. 3. Describe the behavior that each activity driver will encourage, and evaluate the suitability of that behavior for the companys objective of becoming more competitive.arrow_forwardYour company has received an order for 20 units of aproduct. Th e labor cost to produce the item is $9.50 per hour. Th esetup cost for the item is $60 and material costs are $25 per unit. Th e item is sold for $92. Th e learning rate is 80 percent. Overheadis assessed at a rate of 55 percent of unit labor cost.(a) Determine the average unit cost for the 20 units if the fi rstunit takes four hours.(b) Determine the minimum number of units that need to bemade before the selling price meets or exceeds the averageunit cost.arrow_forward
- Click to watch the Tell Me More Learning Objective 3 video and then answer the questions below. 1. The journal entry to recognize depreciation on machinery is ________. a debit to Factory Overhead and a credit to Accumulated Depreciation a debit to Accumulated Depreciation and a credit to Factory Overhead a debit to Factory Overhead and a credit to Depreciation Expense a debit to Depreciation Expense and a credit to Factory Overhead 2. Process and job order cost systems are similar in ________ manner. recording and summarizing product costs classifying product costs as direct materials, direct labor, and factory overhead allocating factory overhead costs to products All of these choices are correct.arrow_forwardE4-23A Use ABC to allocate manufacturing overhead (Learning Objective 2) Several years after reengineering its production process, Biltmore Corporation hired a new controller, Rachael Johnson. She developed an ABC system very similar to the one used by Biltmore’s chief rival, Westriver. Part of the reason Johnson developed the ABC system was because Biltmore’s profits had been declining even though the company had shifted its product mix toward the product that had appeared most profitable under the old system. Before adopting the new ABC system, Biltmore had used a plantwide overhead rate based on direct labor hours that was developed years ago. For the upcoming year, Biltmore’s budgeted ABC manufacturing overhead allocation rates are as follows: Activity Allocation Base Activity Cost Allocation Rate Materials handling # of parts $3.84 per part Machine setup # of setups $330.00 per setup Insertion of parts # of parts $30.00 per part Finishing Finishing DL hrs $54.00 per hour The…arrow_forwardCompute departmental overhead rates (Learning Objective 1)54-4Snyder Snacks makes potato chips, corn chips, and cheese puffs using three different pro- duction lines within the same manufacturing plant . Currently, Snyder uses a single plant- wide overhead rate to allocate its $3,311,500 of annual manufacturing overhead . Of this amount, $2,070,000 is associated with the potato chip line, $763,000 is associated with the corn chip line, and $478,500 is associated with the cheese puff line. Snyder's plant is currently running a total of 17,900 machine hours: 11,500 in the potato chip line, 3,500 in the corn chip line, and 2,900 in the cheese puff line. Snyder considers machine hours to be the cost driver of manufacturing overhead costs .1. What is Snyder's plantwide overhead rate?2. Calculate the departmental overhead rates for Snyder's three production lines. Roundall answers to the nearest cent .3. Which products have been overcosted by the plantwide rate? Which products havebeen…arrow_forward
- Harriman Industries manufactures engines for the aerospace industry. It has completed manufacturing the first unit of the new ZX-9 engine design. Management believes that the 1,000 labor hours required to complete this unit are reasonable and is prepared to go forward with the manufacture of additional units. An 80 percent cumulative average-time learning curve model for direct labor hours is assumed to be valid. Data on costs are as follows: Required: 1. Set up a table with columns for cumulative number of units, cumulative average time per unit in hours, and the cumulative total time in hours. Complete the table for 1, 2, 4, 8, 16, and 32 units. (Round hours to one significant digit.) 2. What are the total variable costs of producing 1, 2, 4, 8, 16, and 32 units? What is the variable cost per unit for 1, 2, 4, 8, 16, and 32 units?arrow_forwardRandy Harris, controller, has been given the charge to implement an advanced cost management system. As part of this process, he needs to identify activity drivers for the activities of the firm. During the past four months, Randy has spent considerable effort identifying activities, their associated costs, and possible drivers for the activities costs. Initially, Randy made his selections based on his own judgment using his experience and input from employees who perform the activities. Later, he used regression analysis to confirm his judgment. Randy prefers to use one driver per activity, provided that an R2 of at least 80 percent can be produced. Otherwise, multiple drivers will be used, based on evidence provided by multiple regression analysis. For example, the activity of inspecting finished goods produced an R2 of less than 80 percent for any single activity driver. Randy believes, however, that a satisfactory cost formula can be developed using two activity drivers: the number of batches and the number of inspection hours. Data collected for a 14-month period are as follows: Required: 1. Calculate the cost formula for inspection costs using the two drivers, inspection hours and number of batches. Are both activity drivers useful? What does the R2 indicate about the formula? 2. Using the formula developed in Requirement 1, calculate the inspection cost when 300 inspection hours are used and 30 batches are produced. Prepare a 90 percent confidence interval for this prediction.arrow_forwardFor each of the following activities, select the most appropriate cost driver. Each cost driver may be used only once. Activity Cost Driver 1. Pay vendors Answer 2. Evaluate vendors Answer 3. Inspect raw materials Answer 4. Plan for purchases of raw materials Answer 5. Packaging Answer 6. Supervision Answer 7. Employee training Answer 8. Clean tables Answer 9. Machine maintenance Answer 10. Move in-process product from one work station to the next Answerarrow_forward
 Managerial Accounting: The Cornerstone of Busines...AccountingISBN:9781337115773Author:Maryanne M. Mowen, Don R. Hansen, Dan L. HeitgerPublisher:Cengage Learning
 Cornerstones of Cost Management (Cornerstones Ser...AccountingISBN:9781305970663Author:Don R. Hansen, Maryanne M. MowenPublisher:Cengage Learning
 Financial And Managerial AccountingAccountingISBN:9781337902663Author:WARREN, Carl S.Publisher:Cengage Learning,