
Videos
Activity-based costing, merchandising. Pharmahelp, Inc., a distributor of special pharmaceutical products, operates at capacity and has three main market segments:
- a. General supermarket chains
- b. Drugstore chains
- c. Mom-and-pop single-store pharmacies
Rick Flair, the new controller of Pharmahelp, reported the following data for 2017.
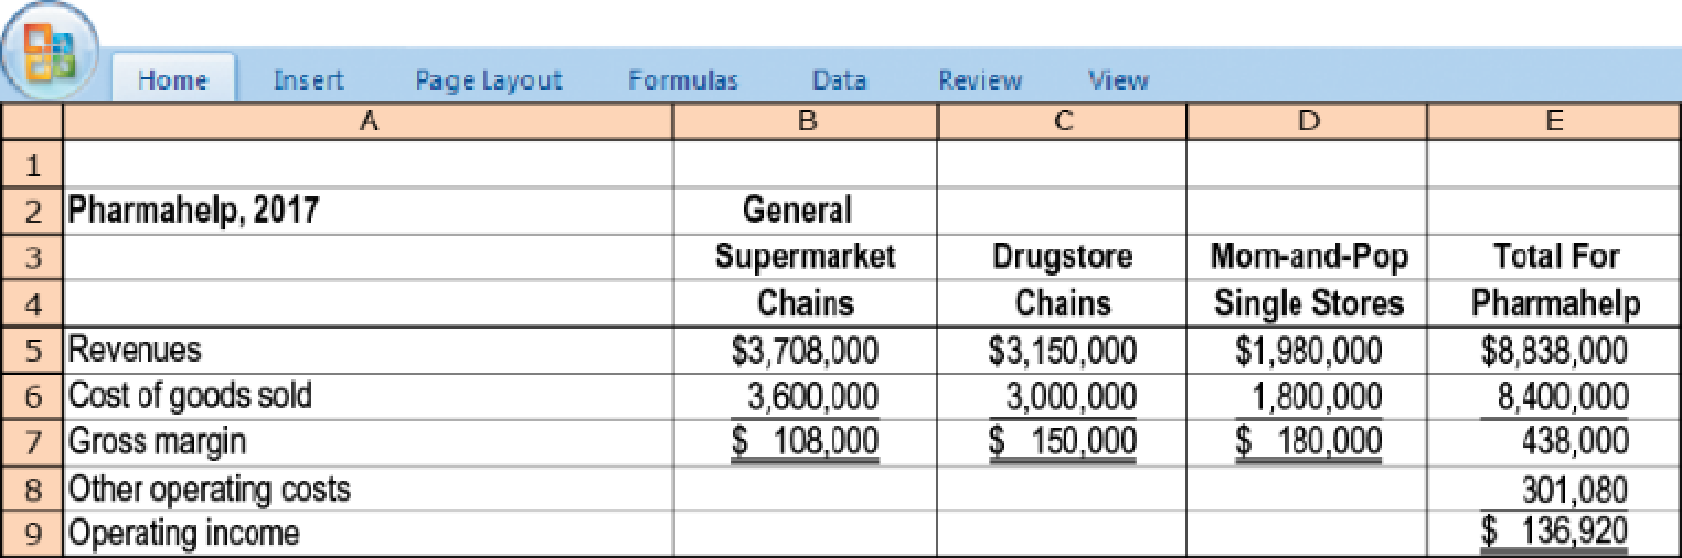
For many years, Pharmahelp has used gross margin percentage
[(Revenue– Cost of goods sold) ÷ Revenue] to evaluate the relative profitability of its market segments. But Flair recently attended a seminar on activity-based costing and is considering using it at Pharmahelp to analyze and allocate “other operating costs.” He meets with all the key managers and several of his operations and sales staff, and they agree that there are five key activities that drive other operating costs at Pharmahelp:
| Activity Area | Cost Driver |
| Order processing | Number of customer purchase orders |
| Line-item processing | Number of line items ordered by customers |
| Delivering to stores | Number of store deliveries |
| Cartons shipped to store | Number of cartons shipped |
| Stocking of customer store shelves | Hours of shelf-stocking |
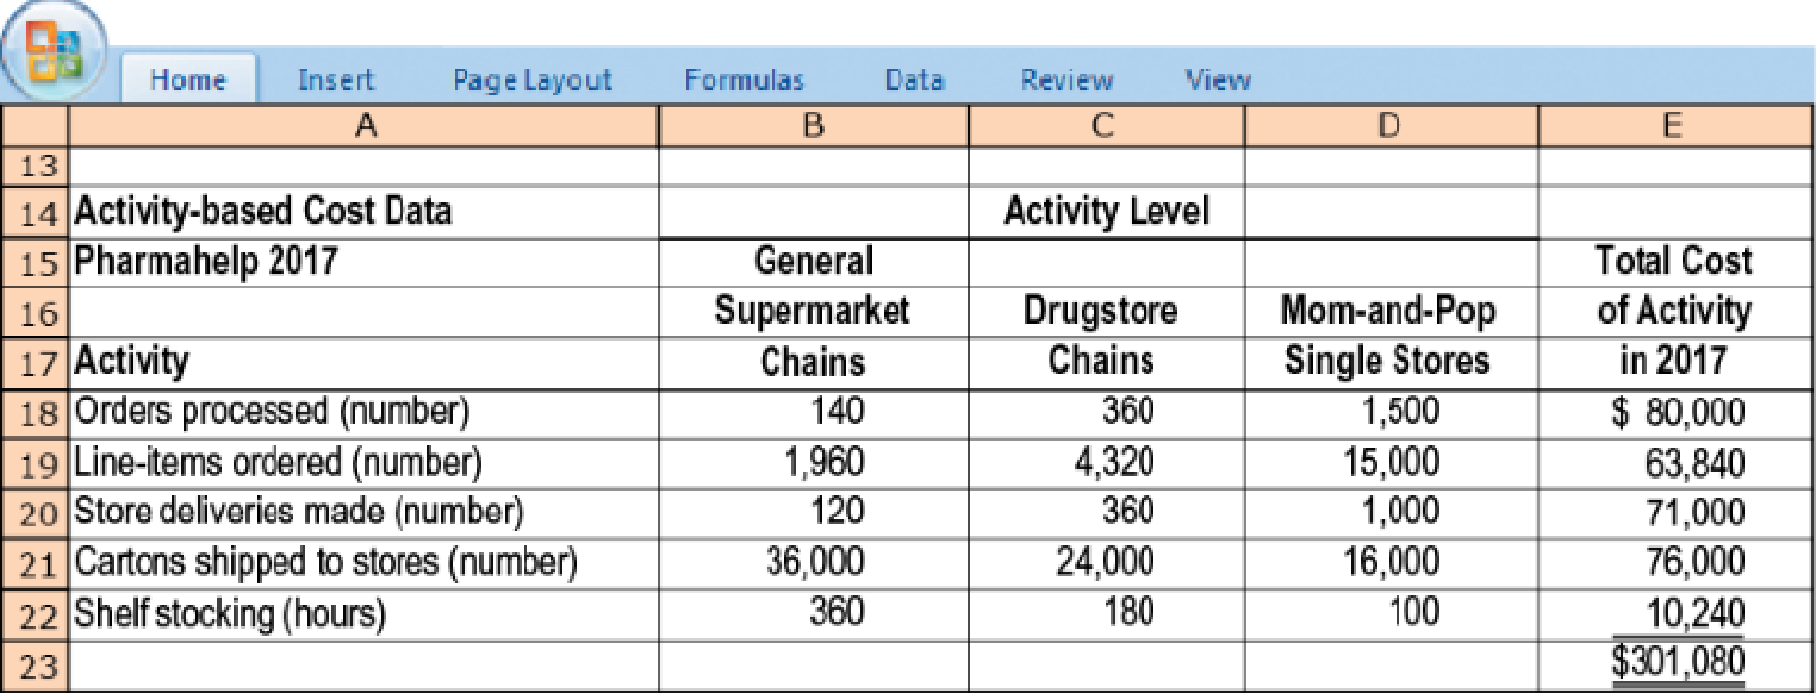
Each customer order consists of one or more line items. A line item represents a single product (such as Extra-Strength Tylenol Tablets). Each product line item is delivered in one or more separate cartons. Each store delivery entails the delivery of one or more cartons of products to a customer. Pharmahelp’s staff stacks cartons directly onto display shelves in customers’ stores. Currently, there is no additional charge to the customer for shelf-stocking and not all customers use Pharmahelp for this activity. The level of each activity in the three market segments and the total cost incurred for each activity in 2017 is as follows:
- 1. Compute the 2017 gross-margin percentage for each of Pharmahelp’s three market segments.
Required
- 2. Compute the cost driver rates for each of the five activity areas.
- 3. Use the activity-based costing information to allocate the $301,080 of “other operating costs” to each of the market segments. Compute the operating income for each market segment.
- 4. Comment on the results. What new insights are available with the activity-based costing information?
Want to see the full answer?
Check out a sample textbook solution
Chapter 5 Solutions
COST ACCOUNTING


- This cost data from Hickory Furniture is for the year 2017. Using the high-low method, express the companys utility costs as an equation where X represents number of tables produced. Predict the utility costs if 800 tables are produced. Predict the utility costs if 600 tables are produced. Using Excel, create a scatter graph of the cost data and explain the relationship between number of tables produced and utility expenses.arrow_forwardFollowing a strategy of product differentiation, Arseniq Company makes a high-end Appliance, XT15. Arseniq presents the following data for the years 2014 and 2015: 2014 59.000 $600 154,000 2015 Units of XT15 produced and aold Selling price Direct materials (square feet) Direct matenals costs per square foot Manufacturing capacity in units of XT15 Total convermon costs 61,500 $650 157,200 $68 63,500 $7.429,500 $60 63,500 $6,985,000 Conversion costs perunit of capaaty Selling and oustomer-ervice capacity (customers) Total selling and customer-ervice conts Selling and customer-service capacity cost per customer $110 $117 190 $2.907,000 $15,300 190 $3,030,500 $15,950 Arseniq produces no defective units but it wants to reduce direct materials usage per unit of XT15. Manufacturing conversion costs in each year depend on production capacity defined in terms of XT15 units that can be produced. Selling and customer-service costs depend on the number of customers that the customer and service…arrow_forwardProduct Profitability Analysis Galaxy Sports Inc. manufactures and sells two styles of All Terrain Vehicles (ATVS), the Conquistador and Hurricane, from a single manufacturing facility. The manufacturing facility operates at 100% of capacity. The following per-unit information is available for the two products: Conquistador Hurricane Sales price $4,800 $3,200 Variable cost of goods sold (3,020) (2,140) Manufacturing margin $1,780 $1,060 Variable selling expenses (964) (548) Contribution margin $816 $512 Fixed expenses (380) (200) Operating income $436 $312 In addition, the following sales unit volume information for the period is as follows: Conquistador 2,800 Hurricane 2,000 Sales unit volume a. Prepare a contribution margin by product report. Compute the contribution margin ratjo for each product as a whole percent. Galaxy Sports Inc. Contribution Margin by Productarrow_forward
- Cole Company sells both designer and moderately priced fashion accessories. Top management is deciding which product line to emphasize. Accountants have provided the following data: (Click the icon to view the data.) Prepare an analysis to show which product the company should emphasize. (Enter the units displayed per square foot and the contribution marain per square foot to two decimal places.) Units displayed per square foot: Designer Moderately priced Contribution margin per unit Contribution margin per square foot of display space Capacity-Square feet of display space Total contribution margin at capacity Show Transcribed Text Data table CO Average sale price Average variable costs Average contribution margin Average fixed costs (allocated) Average operating income. Designer $ $ Ĉ Product Moderately Priced Per Item Designer Moderately Priced 210 $ 100 110 15 95 $ 85 21 64 5 59 The Cole Company store in Grand Junction, Colorado, has 15,000 square feet of floor space. If Cole…arrow_forwardQue. No. 1a. When production is greater than sales which method’s net operating income will be higher, AC or VC and why? Be precise and to the point in writing the answer. Que. No. 1b. Sharp Company manufactures a product for which the following data and information related to inventory is available. The company uses variable costing for internal management reports and absorption costing for external reports to the shareholders, creditors, and the government. The company has provided the following data:Year-1Year-2Year-3Inventories:Beginning (units)200160180Ending (units)160180220Variable Costing net operating income$1,080,400$1,032,400$996,400The company’s fixed manufacturing overhead per unit was constant at $650 for all the three years.Required: 1. Determine each year’s absorption costing net operating income. Present your answer in the form of a reconciliation report. (you must show all calculations)2. In year four, the company’s variable costing net operating income was $984,400…arrow_forwardSlarlet Beauty manufactures and sells a face cream lo small specialy stores in the greater Los Angeles area. It presents the monthly operating income stalement shown here to George Diaz, a polenial investor in the business. Help Mr. Diaz understand Starlet Beauty's cost structure. E(Click the icon to view the operating income stalement.) Read the equirements. Data Table Requirement 1. Recast the income statement to emphasize contribution margin. Starlet Cosmetics Operating Income Statement, June 2017 Starlet Beauty Operating Income Statement, June 2017 10,000 Units sold Revenues 200,000 Cost of goods sold Variable manufacturing costs 80,000 32,900 Fixed manufacturing costs 112,900 Total Gross margin 87,100 Operating costs Variable marketing costs 48,000 17.500 Fixed marketing and administrative costs 65,500 Total operating costs 21,600 Operating income Print Done Choose from any list or enter any number in the input fields and then click Check Answer.arrow_forward
- Calabria Healthcare supplies prescription drugs to pharmacies. As the management accountant,you are required to analyze the financial statements for this quarter. You already have analyzedthe company’s two divisions, Name Brand and Generic, and your supervisor wants an analysis ofthe comparable profitability of the SBUs. The contribution margins are $500,000 and $200,000,respectively; the controllable fixed costs are $200,000 and $50,000; and the noncontrollable fixedcosts are $50,000 and $100,000. Assume there are no nontraceable fixed costs.What are the total contributions by profit center (CPC) for the Name Brand and Genericdivisions, respectively?a. Name Brand: $300,000; Generic: $150,000b. Name Brand: $250,000; Generic: $50,000c. Name Brand: $200,000; Generic: $50,000d. Name Brand: $500,000; Generic: 200,000arrow_forwardSpectrum Corp. makes two products: C and D. The following data have been summarized: (Click the icon to view the data.) Spectrum Corp. desires a 25% target gross profit after covering all product costs. Considering the total product costs assigned to the Products C and D, what would Spectrum have to charge the customer to achieve that gross profit? Round to two decimal places. Begin by selecting the formula to compute the amount that the company should charge for each product. Required sales price per unit Data table Direct materials cost per unit Direct labor cost per unit Indirect manufacturing cost per unit Total costs assigned Print $ $ Product C 600.00 $ 300.00 270.00 1,170.00 S Done - X Product D 2,400.00 200.00 604.00 3,204.00arrow_forwardThe Chocolate Baker specializes in chocolate baked goods. The firm has long assessed the profitability of a product line by comparing revenues to the cost of goods sold. However, Barry White, the firms new accountant, wants to use an activity-based costing system that takes into consideration the cost of the delivery person. Following are activity and cost information relating to two of Chocolate Bakers major products: Using activity-based costing, which of the following statements is correct? a. The muffins are 2,000 more profitable. b. The cheesecakes are 75 more profitable. c. The muffins are 1,925 more profitable. d. The muffins have a higher profitability as a percentage of sales and, therefore, are more advantageous.arrow_forward
- Evaluating selling and administrative cost allocations Gordon Gecco Furniture Company has two major product lines with the following characteristics: Commercial office furniture: Few large orders, little advertising support, shipments in full truckloads, and low handling complexity Home office furniture: Many small orders, large advertising support, shipments in partial truckloads, and high handling complexity The company produced the following profitability report for management: The selling and administrative expenses are allocated to the products on the basis of relative sales dollars. Evaluate the accuracy of this report and recommend an alternative approach.arrow_forward|- books, an online book retailer, has two operating departments-corporate sales and consumer sales-and two support departments-human resources and information systems. Each sales department conducts merchandising and marketing operations independently. I- books uses number of employees to allocate human resources costs and processing time to allocate information systems costs. The following data are available for September 2017: E (Click the icon to view the data.) Read the requirements. Requirement 1. Allocate the support departments' costs to the operating departments using the direct method. (Do not round intermediary calculations. Only round the amount you input in the cell to the nearest dollar. Use parentheses or a minus sign when decreasing departments by allocating costs. Enter a "0" for any zero balances. Abbreviations used: HR = Human resources; Info. = Information.) Support Departments Operating Departments HR Info. Systems Corporate Consumer Total Data Table Costs incurred…arrow_forwardNation's Capital Fitness, Incorporated, operates a chain of fitness centers in the Washington, D.C., area. The firm's controller is accumulating data to be used in preparing its annual profit plan for the coming year. The cost behavior pattern of the firm's equipment maintenance costs must be determined. The accounting staff has suggested the use of an equation, in the form of Y= a + bx, for maintenance costs. Data regarding the maintenance hours and costs for last year are as follows: Month January February March April May June July August September October November December Total Average Hours of Maintenance Service 560 480 280 470 350 460 320 430 490 380 350 340 4,910 409 Maintenance cost Maintenance Costs $ 5,110 4,240 2,730 4,300 3,030 4, 120 3,000 3,590 4,000 3,220 3,170 3,070 $ 43,580 $ 3,632 PR 6-38 (Algo) Part 3 Compute the predicted maintenance cost... 3. Compute the predicted maintenance cost at 670 hours of activity. Answer is complete but not entirely correct. $ 49,192 Xarrow_forward
 Managerial AccountingAccountingISBN:9781337912020Author:Carl Warren, Ph.d. Cma William B. TaylerPublisher:South-Western College Pub
 Financial And Managerial AccountingAccountingISBN:9781337902663Author:WARREN, Carl S.Publisher:Cengage Learning,
 Principles of Cost AccountingAccountingISBN:9781305087408Author:Edward J. Vanderbeck, Maria R. MitchellPublisher:Cengage Learning
 Principles of Accounting Volume 2AccountingISBN:9781947172609Author:OpenStaxPublisher:OpenStax College