Concept explainers
Videos
(a)
To find: The
To find: The least-squares regression line for all four data sets.
To find: The predicted value for
(a)
Answer to Problem 5.42E
The correlation for the data set A is 0.816.
The correlation for the data set B is 0.816.
The correlation for the data set C is 0.816.
The correlation for the data set D is 0.8176.
The least-squares regression line for the data set A is
The least-squares regression line for the data set B is
The least-squares regression line for the data set C is
The least-squares regression line for the data set D is
The predicted value for
The predicted value for
The predicted value for
The predicted value for
Explanation of Solution
Given info:
The four data sets are used to exploring the
Calculation:
Correlation for Data set A:
Software procedure:
Step-by-step procedure to find the correlation between the x and y for data set A by using the MINITAB software:
- Select Stat >Basic Statistics > Correlation.
- In Variables, select x and y.
- Click OK.
Output using the MINITAB software is given below:
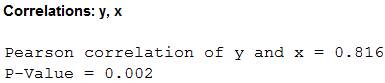
From the MINITAB output, the correlation between the x and y for data set A is 0.816.
Correlation for Data set B:
Software procedure:
Step-by-step procedure to find the correlation between the x and y for data set B by using the MINITAB software:
- Select Stat >Basic Statistics > Correlation.
- In Variables, select x and y.
- Click OK.
Output using the MINITAB software is given below:
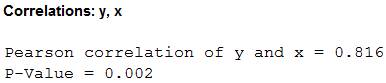
From the MINITAB output, the correlation between the x and y for data set B is 0.816.
Correlation for Data set C:
Software procedure:
Step-by-step procedure to find the correlation between the x and y for data set C by using the MINITAB software:
- Select Stat >Basic Statistics > Correlation.
- In Variables, select x and y.
- Click OK.
Output using the MINITAB software is given below:
From the MINITAB output, the correlation between the x and y for data set C is 0.816.
Correlation for Data set D:
Software procedure:
Step-by-step procedure to find the correlation between the x and y for data set D by using the MINITAB software:
- Select Stat >Basic Statistics > Correlation.
- In Variables, select x and y.
- Click OK.
Output using the MINITAB software is given below:
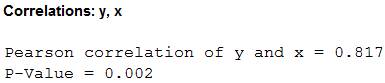
From the MINITAB output, the correlation between the x and y for data set D is 0.817.
Equation of the least-squares line for Data set A:
Software procedure:
Step-by-step procedure to find the equation of the least-squares line by using the MINITAB software:
- Choose Stat > Regression > Regression.
- In Responses, enter the column of y.
- In Predictors, enter the column of x.
- Click OK.
Output using the MINITAB software is given below:
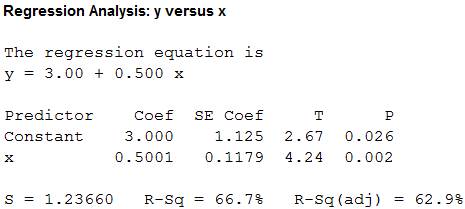
From the MINITAB output, the least-squares line for predicting y from x for data set A is
Equation of the least-squares line for Data set B:
Software procedure:
Step-by-step procedure to find the equation of the least-squares line by using the MINITAB software:
- Choose Stat > Regression > Regression.
- In Responses, enter the column of y.
- In Predictors, enter the column of x.
- Click OK.
Output using the MINITAB software is given below:
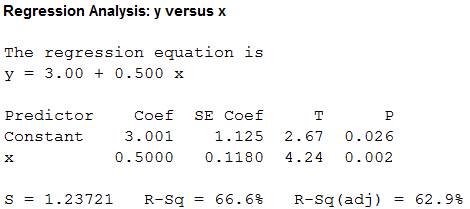
From the MINITAB output, the least-squares line for predicting y from x for data set B is
Equation of the least-squares line for Data set C:
Software procedure:
Step-by-step procedure to find the equation of the least-squares line by using the MINITAB software:
- Choose Stat > Regression > Regression.
- In Responses, enter the column of y.
- In Predictors, enter the column of x.
- Click OK.
Output using the MINITAB software is given below:
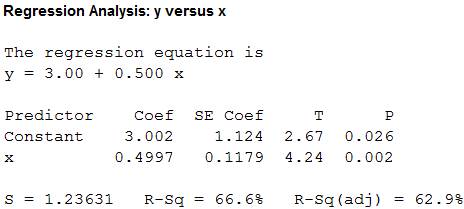
From the MINITAB output, the least-squares line for predicting y from x for data set C is
Equation of the least-squares line for Data set D:
Software procedure:
Step-by-step procedure to find the equation of the least-squares line by using the MINITAB software:
- Choose Stat > Regression > Regression.
- In Responses, enter the column of y.
- In Predictors, enter the column of x.
- Click OK.
Output using the MINITAB software is given below:
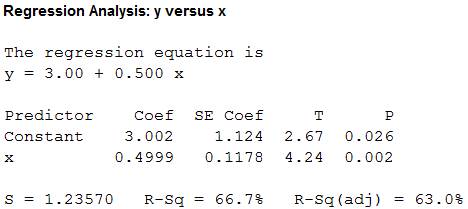
From the MINITAB output, the least-squares line for predicting y from x for data set D is
Predicted value for
Software procedure:
Step-by-step procedure to find the predicted value for
- Choose Stat > Regression > Regression.
- In Responses, enter the column of y.
- In Predictors, enter the column of x.
- In option, enter 10 under prediction.
- Click OK.
Output using the MINITAB software is given below:
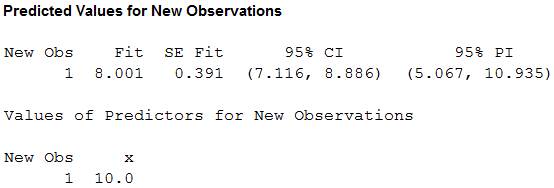
From the MINITAB output, the predicted value for
Predicted value for
Software procedure:
Step-by-step procedure to find the predicted value for
- Choose Stat > Regression > Regression.
- In Responses, enter the column of y.
- In Predictors, enter the column of x.
- In option, enter 10 under prediction.
- Click OK.
Output using the MINITAB software is given below:
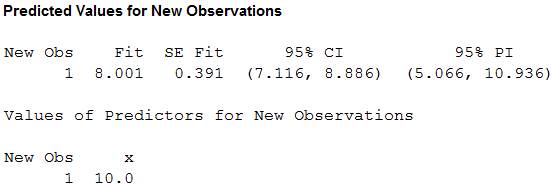
From the MINITAB output, the predicted value for
Predicted value for
Software procedure:
Step-by-step procedure to find the predicted value for
- Choose Stat > Regression > Regression.
- In Responses, enter the column of y.
- In Predictors, enter the column of x.
- In option, enter 10 under prediction.
- Click OK.
Output using the MINITAB software is given below:
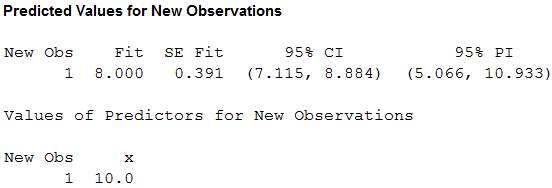
From the MINITAB output, the predicted value for
Predicted value for
Software procedure:
Step-by-step procedure to find the predicted value for
- Choose Stat > Regression > Regression.
- In Responses, enter the column of y.
- In Predictors, enter the column of x.
- In option, enter 10 under prediction.
- Click OK.
Output using the MINITAB software is given below:
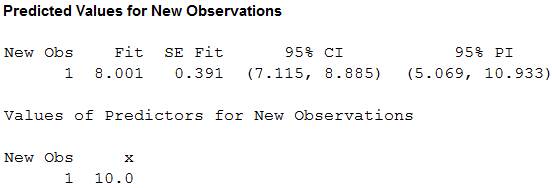
From the MINITAB output, the predicted value for
From the results, it can be observed that the correlation for all four data sets, the least-squares regression line and the predicted value for
(b)
To construct: The
(b)
Answer to Problem 5.42E
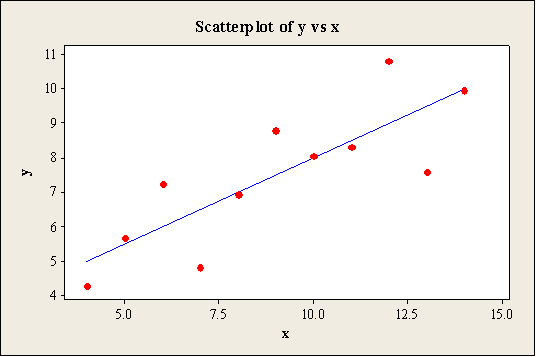
Scatterplot for Data set A:
Output using the MINITAB software is given below:
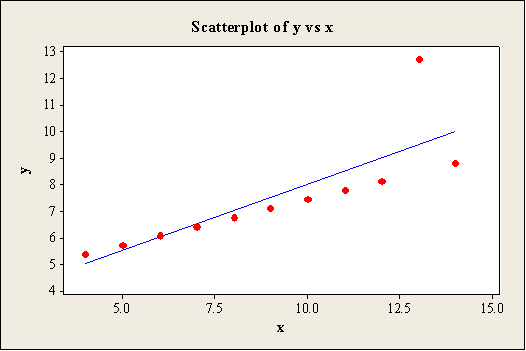
Scatterplot for Data set B:
Output using the MINITAB software is given below:
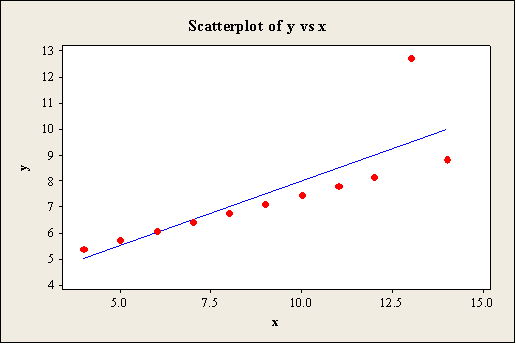
Scatterplot for Data set C:
Output using the MINITAB software is given below:
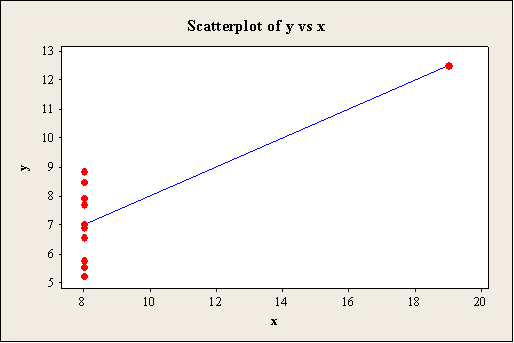
Scatterplot for Data set D:
Output using the MINITAB software is given below:
Explanation of Solution
Calculation:
Scatterplot:
Software procedure:
Step-by-step procedure to construct scatterplot for x and y for all four data sets by using the MINITAB software:
- Choose Graph > Scatter plot.
- Choose With Regression, and then click OK.
- Under Y variables, enter a column of y.
- Under X variables, enter a column of x.
- Click OK.
Observation:
The scatterplot shows that the predicted values are passed through the regression line of the model. Moreover, there is outlier that appears in the x and y directions for the data set A, B, and C. Also, the scatterplot for the data set D shows that the most of the points are plotted around 8.
(c)
To identify: Which of the four cases would you be willing to use the regression line to describe the dependence of y on x.
(c)
Answer to Problem 5.42E
The data set A would use the regression line to describe the dependence of y on x.
Explanation of Solution
From the scatterplots for all data sets, it can be observed that the points for data set A are scattered around the straight line when compared to the other data sets. Hence, the data set A would use the regression line to describe the dependence of y on x.
Want to see more full solutions like this?
Chapter 5 Solutions
The Basic Practice of Statistics


 MATLAB: An Introduction with ApplicationsStatisticsISBN:9781119256830Author:Amos GilatPublisher:John Wiley & Sons Inc
 Probability and Statistics for Engineering and th...StatisticsISBN:9781305251809Author:Jay L. DevorePublisher:Cengage Learning
 Statistics for The Behavioral Sciences (MindTap C...StatisticsISBN:9781305504912Author:Frederick J Gravetter, Larry B. WallnauPublisher:Cengage Learning
 Elementary Statistics: Picturing the World (7th E...StatisticsISBN:9780134683416Author:Ron Larson, Betsy FarberPublisher:PEARSON
 The Basic Practice of StatisticsStatisticsISBN:9781319042578Author:David S. Moore, William I. Notz, Michael A. FlignerPublisher:W. H. Freeman
 Introduction to the Practice of StatisticsStatisticsISBN:9781319013387Author:David S. Moore, George P. McCabe, Bruce A. CraigPublisher:W. H. Freeman