
Concept explainers
Videos
The accompanying bar graph shows the amount of money, in buillions of dollars, collected and spent by the U.S. government in selected years from 2001 through 2016. Use the information from the graph to solve Exercises 127–130. Express answers in billions of dollars.
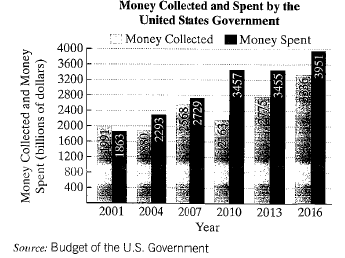
127. a. In 2001, what was the difference between the amount of money collected and the amount spend? Was there a budget surplus or deficit in 2001?
b. In 2016, what was the difference between the amount of money collected and the amount spent? Was there a budget surplus or deficit in 2016?
c. What is the difference between the 2001 surplus and the 2016 deficit?
Want to see the full answer?
Check out a sample textbook solution
Chapter 5 Solutions
Thinking Mathematically, Books a la Carte Edition plus MyLab Math with Pearson eText -- Access Card Package, 4/e (7th Edition)


- Please explain and answer, thank you.arrow_forwardOn the last three physics exams a student scored 85, 87, and 88. What score must the student earn on the next exam to have an average of at least 90? %. The student must score at least (Simplify your answer. Type an integer or a decimal.)arrow_forwardHow to calculate a and b from the table?arrow_forward
 College Algebra (MindTap Course List)AlgebraISBN:9781305652231Author:R. David Gustafson, Jeff HughesPublisher:Cengage Learning
 Holt Mcdougal Larson Pre-algebra: Student Edition...AlgebraISBN:9780547587776Author:HOLT MCDOUGALPublisher:HOLT MCDOUGAL
 Algebra: Structure And Method, Book 1AlgebraISBN:9780395977224Author:Richard G. Brown, Mary P. Dolciani, Robert H. Sorgenfrey, William L. ColePublisher:McDougal Littell
 Mathematics For Machine TechnologyAdvanced MathISBN:9781337798310Author:Peterson, John.Publisher:Cengage Learning,