
Concept explainers
Videos
(a)
Appropriate graph to display the relationship between average temperature and average crawling age and discuss the observations.
(a)
Answer to Problem 59E
Linear, negative, and moderately strong association with one outlier.
Explanation of Solution
Given information:
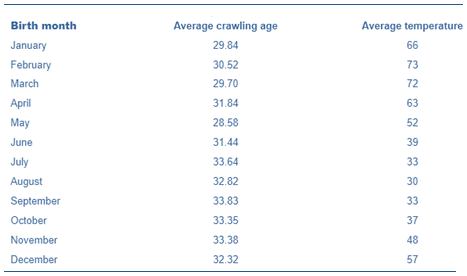
Information obtained for the month that is 6 months after the birth month:

On horizontal axis,
Average temperature has been represented.
On vertical axis,
Average crawling age has been represented.
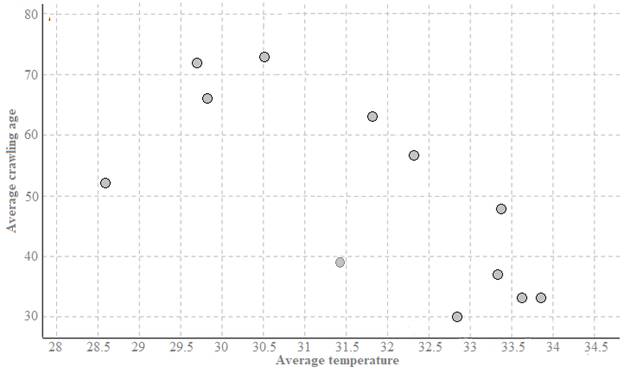
Form: Linear, because in the scatterplot no strong curvature exists.
Strength: Moderately strong, because the points in the scatterplot are not spread far apart and do not lie extremely close together.
Unusual features: It has been shown that the leftmost in the scatterplot seems to deviate from the general linear pattern in the other points; one outlier appears to be there.
Direction: Negative, the pattern slops downward in the scatterplot.
This implies
There is a negative, linear, moderately strong association between the average temperature and the average crawling age, an outlier also exists in the scatterplot.
(b)
Equation of the least − square regression line describing the relationship between average temperature and average crawling age.
(b)
Answer to Problem 59E
Equation for least - square regression line,
Explanation of Solution
Given information:
Information obtained for the month that is 6 months after the birth month:
Least − squares regression line (general equation):
From computer output,
Slope
And
Constant
Substitute the values of
Where,
x : average temperature
y : average crawling age
(c)
Interpretation of slope of regression line.
(c)
Answer to Problem 59E
On average, the average crawling age drops by an average temperature of 0.0777 weeks per
Explanation of Solution
Given information:
Information obtained for the month that is 6 months after the birth month:

From Part (b),
Least − squares regression line general equation:
Where,
x : average temperature
y : average crawling age
Now,
In the least square regression equation,
The slope is the coefficient of x .
And
Also represents the average increase (or decrease) of y per unit of x .
Thus,
On average, the average crawling age drops by an average temperature of 0.0777 weeks per
(d)
Whether it can be concluded that warmer temperature 6 months after babies are born causes them to crawl sooner.
(d)
Answer to Problem 59E
No, the statement cannot be concluded.
Explanation of Solution
Given information:
Information obtained for the month that is 6 months after the birth month:

From Part (a),
We came to know that
There was a linear, negative, moderately strong association between the average temperature and average crawling age.
However,
This association does not mean causation.
Which means
The increasing average temperature does not necessarily cause a decrease in average crawling age.
Thus,
We cannot conclude that warmer temperature 6 months after babies are born causes them to crawl sooner.
Chapter 5 Solutions
PRACTICE OF STATISTICS F/AP EXAM
Additional Math Textbook Solutions
Elementary Statistics
Elementary Statistics Using Excel (6th Edition)
Elementary Statistics (13th Edition)
Statistics: The Art and Science of Learning from Data (4th Edition)
Basic Business Statistics, Student Value Edition
Essentials of Statistics (6th Edition)


 MATLAB: An Introduction with ApplicationsStatisticsISBN:9781119256830Author:Amos GilatPublisher:John Wiley & Sons Inc
 Probability and Statistics for Engineering and th...StatisticsISBN:9781305251809Author:Jay L. DevorePublisher:Cengage Learning
 Statistics for The Behavioral Sciences (MindTap C...StatisticsISBN:9781305504912Author:Frederick J Gravetter, Larry B. WallnauPublisher:Cengage Learning
 Elementary Statistics: Picturing the World (7th E...StatisticsISBN:9780134683416Author:Ron Larson, Betsy FarberPublisher:PEARSON
 The Basic Practice of StatisticsStatisticsISBN:9781319042578Author:David S. Moore, William I. Notz, Michael A. FlignerPublisher:W. H. Freeman
 Introduction to the Practice of StatisticsStatisticsISBN:9781319013387Author:David S. Moore, George P. McCabe, Bruce A. CraigPublisher:W. H. Freeman