DEVELOP.MATH(3 VOLS) CUSTOM-W/MML <IC<
16th Edition
ISBN: 9781323235911
Author: BITTINGER
Publisher: Pearson Custom Publishing
expand_more
expand_more
format_list_bulleted
Videos
Question
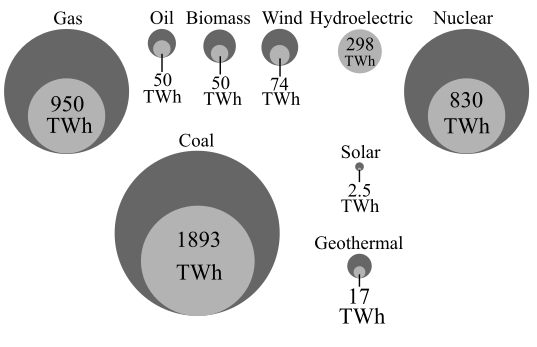
Chapter 5.2, Problem 9DE
To determine
The amount of electricity generated by the gas annually when the graph that shows the various method to generated electricity in U.S. in which the yellow circle represents the amount of electricity generated from different sources in terawatt-hours per year (TWh) and the larger circle surrounding yellow circle represents the electricity that could have been generated if the method were 100% efficient.
Expert Solution & Answer
Want to see the full answer?
Check out a sample textbook solution
Students have asked these similar questions
Exercises 83–86: The table lists data that are exactly linear.
a. Find the slope-intercept form of the line that passes through these
data points.
b. Predict y when x = -2.7 and 6.3. Decide if these calculations
involve interpolation or extrapolation.
-3
-2
-1
1
83.
y
-7.7
-6.2
-4.7
-3.2
-1.7
21–23. Language enrollments. The line graph in Figure 2.28 shows total course enrollments in languages
other than English in U.S. institutions of higher education from 1960 to 2009. (Enrollments in ancient Greek
and Latin are not included.) Exercises 21 through 23 refer to this figure.
1,800,000
1,629,326
1.522.770
1,600,000 -
1,400,000 -
1347.036
1,200,000-
1,073,097 1,067,217
1,000.000 - 975.7m
963,930
883.222
1.06.603
922,439
960.588
B00,000 -
97.077 877.91
600,000 -
608,749
400.000 -
200,000 -
1960
1965 1968 | 1972 1977 1980 1983 1986 1990
1995 199 2002 2006 2009
1970 1974
Figure 2.28
Crauder, et al., Quantitative Literacy, 3e, © 2019 W. H. Freeman and
Company
FIGURE 2.28 Enrollments in languages other than English in U.S. institutions of higher education (2009).
21. During which time periods did the enrollments decrease?
22. Calculate the average growth rate per year in enrollments over the two periods 1960–1965 and 2006–
2009. Note that the time periods are not of the same…
Complete the following table: LU 6-2(3)
6–50.
6–51.
Chapter 5 Solutions
DEVELOP.MATH(3 VOLS) CUSTOM-W/MML <IC<
Ch. 5.1 - Objectives 1.6c and 3.4c:Simplify expressions...Ch. 5.1 - Prob. 2SRCh. 5.1 - Prob. 1DECh. 5.1 - Prob. 2DECh. 5.1 - Prob. 3DECh. 5.1 - Prob. 4DECh. 5.1 - GS Sohas sociology professor included the...Ch. 5.1 - Prob. 6DECh. 5.1 - Prob. 7DECh. 5.1 - Prob. 8DE
Ch. 5.1 - Prob. 9DECh. 5.1 - Prob. 10DECh. 5.1 - Prob. 11DECh. 5.1 - Prob. 12DECh. 5.1 - Prob. 13DECh. 5.1 - Prob. 14DECh. 5.1 - Prob. 15DECh. 5.1 - 16. In a lab, Gina determined the mass, in grams,...Ch. 5.1 - Prob. 1RCCh. 5.1 - Prob. 2RCCh. 5.1 - Prob. 3RCCh. 5.1 - Prob. 4RCCh. 5.1 - Prob. 1ESCh. 5.1 - Prob. 2ESCh. 5.1 - Prob. 3ESCh. 5.1 - Prob. 4ESCh. 5.1 - Prob. 5ESCh. 5.1 - Prob. 6ESCh. 5.1 - Prob. 7ESCh. 5.1 - Prob. 8ESCh. 5.1 - Prob. 9ESCh. 5.1 - Prob. 10ESCh. 5.1 - Prob. 11ESCh. 5.1 - Prob. 12ESCh. 5.1 - Prob. 13ESCh. 5.1 - Prob. 14ESCh. 5.1 - Prob. 15ESCh. 5.1 - Prob. 16ESCh. 5.1 - Grading. To get a B in math, Rich must score an...Ch. 5.1 - Prob. 18ESCh. 5.1 - Prob. 19ESCh. 5.1 - Prob. 20ESCh. 5.1 - Median Home Prices. The following table lists the...Ch. 5.1 - Prob. 22ESCh. 5.1 - Movie Ticket Sales. The following table lists the...Ch. 5.1 - Prob. 24ESCh. 5.1 - Prob. 25ESCh. 5.1 - Prob. 26ESCh. 5.1 - Prob. 27ESCh. 5.1 - Prob. 28ESCh. 5.1 - Prob. 29ESCh. 5.1 - Prob. 30ESCh. 5.1 - Prob. 31ESCh. 5.2 - Objective 2.4d: Multiply using mixed numerals....Ch. 5.2 - Prob. 2SRCh. 5.2 - Use the table in Example 1 to answer Margin...Ch. 5.2 - Prob. 2DECh. 5.2 - Prob. 3DECh. 5.2 - Prob. 4DECh. 5.2 - Prob. 5DECh. 5.2 - Prob. 6DECh. 5.2 - Prob. 7DECh. 5.2 - Prob. 8DECh. 5.2 - Prob. 9DECh. 5.2 - Prob. 10DECh. 5.2 - Prob. 11DECh. 5.2 - Prob. 12DECh. 5.2 - Prob. 13DECh. 5.2 - Prob. 14DECh. 5.2 - Prob. 15DECh. 5.2 - Prob. 1RCCh. 5.2 - Prob. 2RCCh. 5.2 - Prob. 3RCCh. 5.2 - Prob. 4RCCh. 5.2 - Prob. 1ESCh. 5.2 - Prob. 2ESCh. 5.2 - Prob. 3ESCh. 5.2 - Prob. 4ESCh. 5.2 - Prob. 5ESCh. 5.2 - Prob. 6ESCh. 5.2 - Prob. 7ESCh. 5.2 - Prob. 8ESCh. 5.2 - Prob. 9ESCh. 5.2 - Prob. 10ESCh. 5.2 - Prob. 11ESCh. 5.2 - Prob. 12ESCh. 5.2 - Prob. 13ESCh. 5.2 - Prob. 14ESCh. 5.2 - Prob. 15ESCh. 5.2 - Prob. 16ESCh. 5.2 - Prob. 17ESCh. 5.2 - Prob. 18ESCh. 5.2 - Prob. 19ESCh. 5.2 - Prob. 20ESCh. 5.2 - Prob. 21ESCh. 5.2 - Prob. 22ESCh. 5.2 - Prob. 23ESCh. 5.2 - Prob. 24ESCh. 5.2 - Prob. 25ESCh. 5.2 - Prob. 26ESCh. 5.2 - Prob. 27ESCh. 5.2 - Prob. 28ESCh. 5.2 - Prob. 29ESCh. 5.2 - Prob. 30ESCh. 5.2 - Prob. 31ESCh. 5.2 - Prob. 32ESCh. 5.2 - Prob. 33ESCh. 5.2 - Prob. 34ESCh. 5.2 - Prob. 35ESCh. 5.2 - Prob. 36ESCh. 5.2 - Prob. 37ESCh. 5.2 - Prob. 38ESCh. 5.2 - Personal Consumption Expenditures. The following...Ch. 5.2 - Personal Consumption Expenditures. The following...Ch. 5.2 - Prob. 41ESCh. 5.2 - Prob. 42ESCh. 5.2 - Prob. 43ESCh. 5.2 - Prob. 44ESCh. 5.2 - Prob. 1MCRCh. 5.2 - Prob. 2MCRCh. 5.2 - Prob. 3MCRCh. 5.2 - Prob. 4MCRCh. 5.2 - Prob. 5MCRCh. 5.2 - Prob. 6MCRCh. 5.2 - Prob. 7MCRCh. 5.2 - Prob. 8MCRCh. 5.2 - Prob. 9MCRCh. 5.2 - Prob. 10MCRCh. 5.2 - Prob. 11MCRCh. 5.2 - Prob. 12MCRCh. 5.2 - Prob. 13MCRCh. 5.2 - Prob. 14MCRCh. 5.2 - Prob. 15MCRCh. 5.2 - Prob. 16MCRCh. 5.2 - Downsizing. Companies sometimes downsize their...Ch. 5.2 - Prob. 18MCRCh. 5.2 - Prob. 19MCRCh. 5.2 - Prob. 20MCRCh. 5.2 - Prob. 21MCRCh. 5.2 - Prob. 22MCRCh. 5.2 - Prob. 23UTDWCh. 5.2 - Answers to Exercises 23 and 24 can be found on...Ch. 5.3 - Objective 3.1c: Given a pair of numbers in decimal...Ch. 5.3 - Objective 3.1c: Given a pair of numbers in decimal...Ch. 5.3 - Prob. 1DECh. 5.3 - Prob. 2DECh. 5.3 - Prob. 3DECh. 5.3 - Prob. 4DECh. 5.3 - Prob. 5DECh. 5.3 - Prob. 6DECh. 5.3 - Prob. 7DECh. 5.3 - Prob. 8DECh. 5.3 - Prob. 1RCCh. 5.3 - Prob. 2RCCh. 5.3 - Prob. 3RCCh. 5.3 - Prob. 4RCCh. 5.3 - Prob. 1ESCh. 5.3 - Prob. 2ESCh. 5.3 - Prob. 3ESCh. 5.3 - Prob. 4ESCh. 5.3 - Prob. 5ESCh. 5.3 - Prob. 6ESCh. 5.3 - Prob. 7ESCh. 5.3 - Prob. 8ESCh. 5.3 - Prob. 9ESCh. 5.3 - Prob. 10ESCh. 5.3 - Prob. 11ESCh. 5.3 - Prob. 12ESCh. 5.3 - Prob. 13ESCh. 5.3 - Prob. 14ESCh. 5.3 - Prob. 15ESCh. 5.3 - Prob. 16ESCh. 5.3 - Prob. 17ESCh. 5.3 - Prob. 18ESCh. 5.3 - Prob. 19ESCh. 5.3 - Prob. 20ESCh. 5.3 - Prob. 21ESCh. 5.3 - Prob. 22ESCh. 5.3 - Prob. 23ESCh. 5.3 - Prob. 24ESCh. 5.3 - Prob. 25ESCh. 5.3 - Prob. 26ESCh. 5.3 - Prob. 27ESCh. 5.3 - Prob. 28ESCh. 5.3 - Prob. 29ESCh. 5.3 - Prob. 30ESCh. 5.3 - Prob. 31ESCh. 5.3 - Prob. 32ESCh. 5.3 - Prob. 33ESCh. 5.3 - Prob. 34ESCh. 5.3 - Prob. 35ESCh. 5.3 - Prob. 36ESCh. 5.3 - Prob. 37ESCh. 5.3 - Prob. 38ESCh. 5.3 - Prob. 39ESCh. 5.3 - Prob. 40ESCh. 5.3 - Prob. 41ESCh. 5.3 - Prob. 42ESCh. 5.3 - Prob. 43ESCh. 5.3 - Prob. 44ESCh. 5.3 - Prob. 45ESCh. 5.3 - Prob. 46ESCh. 5.3 - Prob. 47ESCh. 5.3 - Prob. 48ESCh. 5.3 - Prob. 49ESCh. 5.3 - Prob. 50ESCh. 5.3 - Prob. 51ESCh. 5.3 - Prob. 52ESCh. 5.3 - Prob. 53ESCh. 5.3 - Prob. 54ESCh. 5.3 - Prob. 55ESCh. 5.3 - Prob. 56ESCh. 5.3 - Prob. 57ESCh. 5.3 - Prob. 58ESCh. 5.3 - Prob. 59ESCh. 5.3 - Prob. 60ESCh. 5.4 - Objective 4.3a: Convert from fraction notation to...Ch. 5.4 - Prob. 2SRCh. 5.4 - Prob. 1DECh. 5.4 - Prob. 2DECh. 5.4 - Prob. 3DECh. 5.4 - Prob. 4DECh. 5.4 - Prob. 1TFSCh. 5.4 - Prob. 2TFSCh. 5.4 - Prob. 3TFSCh. 5.4 - Prob. 4TFSCh. 5.4 - Prob. 5TFSCh. 5.4 - The goal of these matching questions is to...Ch. 5.4 - Prob. 7TFSCh. 5.4 - Prob. 8TFSCh. 5.4 - Prob. 9TFSCh. 5.4 - Prob. 10TFSCh. 5.4 - Prob. 1RCCh. 5.4 - Prob. 2RCCh. 5.4 - Prob. 3RCCh. 5.4 - Prob. 4RCCh. 5.4 - Prob. 5RCCh. 5.4 - Prob. 6RCCh. 5.4 - Prob. 1ESCh. 5.4 - Prob. 2ESCh. 5.4 - Prob. 3ESCh. 5.4 - Prob. 4ESCh. 5.4 - Prob. 5ESCh. 5.4 - Prob. 6ESCh. 5.4 - Prob. 7ESCh. 5.4 - Prob. 8ESCh. 5.4 - Prob. 9ESCh. 5.4 - Prob. 10ESCh. 5 - Complete each statement with the correct term from...Ch. 5 - Prob. 2VRCh. 5 - Prob. 3VRCh. 5 - Prob. 4VRCh. 5 - Prob. 5VRCh. 5 - Prob. 6VRCh. 5 - Prob. 1CORCh. 5 - Prob. 2CORCh. 5 - Prob. 3CORCh. 5 - Prob. 1SGPECh. 5 - 2. Use the table in the example shown above for...Ch. 5 - Which oatmeal has the greatest cost per serving?...Ch. 5 - Prob. 4SGPECh. 5 - Prob. 5SGPECh. 5 - Prob. 6SGPECh. 5 - Use the circle graph at left to answer Exercises 7...Ch. 5 - Use the circle graph at left to answer Exercises 7...Ch. 5 - Prob. 1RECh. 5 - Prob. 2RECh. 5 - Prob. 3RECh. 5 - Prob. 4RECh. 5 - Prob. 5RECh. 5 - Prob. 6RECh. 5 - Prob. 7RECh. 5 - Gas Mileage. A 2012 Mazda Miata does 336 mi of...Ch. 5 - Prob. 9RECh. 5 - Prob. 10RECh. 5 - Prob. 11RECh. 5 - Prob. 12RECh. 5 - Prob. 13RECh. 5 - Prob. 14RECh. 5 - Prob. 15RECh. 5 - Prob. 16RECh. 5 - Prob. 17RECh. 5 - Prob. 18RECh. 5 - Prob. 19RECh. 5 - Prob. 20RECh. 5 - Prob. 21RECh. 5 - Prob. 22RECh. 5 - Prob. 23RECh. 5 - Prob. 24RECh. 5 - Prob. 25RECh. 5 - Prob. 26RECh. 5 - Major League World Series. Except for four years,...Ch. 5 - Prob. 28RECh. 5 - Prob. 29RECh. 5 - Prob. 30RECh. 5 - Prob. 31RECh. 5 - Prob. 32RECh. 5 - Prob. 33RECh. 5 - Prob. 34RECh. 5 - Prob. 35RECh. 5 - Prob. 36RECh. 5 - Prob. 37RECh. 5 - Prob. 38RECh. 5 - Prob. 39RECh. 5 - Prob. 40RECh. 5 - Prob. 41RECh. 5 - Prob. 42RECh. 5 - Prob. 43RECh. 5 - Prob. 44RECh. 5 - Prob. 45RECh. 5 - What is the average of this set of data?...Ch. 5 - Prob. 47RECh. 5 - Prob. 48RECh. 5 - Prob. 49RECh. 5 - Prob. 50RECh. 5 - Prob. 1UTDWCh. 5 - Prob. 2UTDWCh. 5 - Prob. 3UTDWCh. 5 - Prob. 4UTDWCh. 5 - Prob. 5UTDWCh. 5 - Prob. 6UTDWCh. 5 - Prob. 1TCh. 5 - Prob. 2TCh. 5 - Prob. 3TCh. 5 - Prob. 4TCh. 5 - Prob. 5TCh. 5 - Prob. 6TCh. 5 - Prob. 7TCh. 5 - Prob. 8TCh. 5 - Prob. 9TCh. 5 - Prob. 10TCh. 5 - Prob. 11TCh. 5 - Prob. 12TCh. 5 - Prob. 13TCh. 5 - Prob. 14TCh. 5 - Prob. 15TCh. 5 - Prob. 16TCh. 5 - Prob. 17TCh. 5 - Prob. 18TCh. 5 - Prob. 19TCh. 5 - Prob. 20TCh. 5 - Prob. 21TCh. 5 - Prob. 22TCh. 5 - Prob. 23TCh. 5 - Prob. 24TCh. 5 - Prob. 25TCh. 5 - 26. Referring to Exercise 25, consider a family...
Knowledge Booster


Learn more about
Need a deep-dive on the concept behind this application? Look no further. Learn more about this topic, subject and related others by exploring similar questions and additional content below.Similar questions
- World Military Expenditure The following chart shows total military and arms trade expenditure from 2011–2020 (t = 1 represents 2011). †A bar graph titled "World military expenditure" has a horizontal t-axis labeled "Year since 2010" and a vertical axis labeled "$ (billions)". The bar graph has 10 bars. Each bar is associated with a label and an approximate value as listed below. 1: 1,800 billion dollars 2: 1,775 billion dollars 3: 1,750 billion dollars 4: 1,730 billion dollars 5: 1,760 billion dollars 6: 1,760 billion dollars 7: 1,850 billion dollars 8: 1,900 billion dollars 9: 1,950 billion dollars 10: 1,980 billion dollars (a) If you want to model the expenditure figures with a function of the form f(t) = at2 + bt + c, would you expect the coefficient a to be positive or negative? Why? HINT [See "Features of a Parabola" in this section.] We would expect the coefficient to be positive because the curve is concave up. We would expect the coefficient to be negative because the…arrow_forwardThe line graphs in Figure show the percentages of marriages ending in divorce based on the wife’s age at marriage.Here are two mathematical models that approximate the data displayed by the line graphs:In each model, the variable n is the number of years after marriage and the variable d is the percentage of marriages ending in divorce.a. Use the appropriate formula to determine the percentage of marriagesending in divorce after 10 years when the wife is over 25 at the time ofmarriage.b. Use the appropriate line graph in Figure to determine the percentageof marriages ending in divorce after 10 years when the wife is over 25 at the time of marriage.c. Does the value given by the mathematical model underestimate or overestimate the actual percentage of marriages ending in divorce after10 years as shown by the graph? By how much?arrow_forwardU.S. Population The number of White non-Hispanicindividuals in the U.S. civilian non-institutional population 16 years and older was 153.1 million in 2000and is projected to be 169.4 million in 2050.(Source: U.S. Census Bureau)a. Find the average annual rate of change in population during the period 2000–2050, with the appropriate units.b. Use the slope from part (a) and the population in2000 to write the equation of the line associatedwith 2000 and 2050.c. What does this model project the population to bein 2020?arrow_forward
- Solve the variation problems in Exercises 68–73. 68. A company's profit varies directly as the number of products it sells. The company makes a profit of $1175 on the sale of 25 products. What is the company's profit when it sells 105 products? 69. The distance that a body falls from rest varies directly as the square of the time of the fall. If skydivers fall 144 feet in 3 seconds, how far will they fall in 10 seconds? 70. The pitch of a musical tone varies inversely as its wavelength. A tone has a pitch of 660 vibrations per second and a wavelength of 1.6 feet. What is the pitch of a tone that has a wavelength of 2.4 feet? 71. The loudness of a stereo speaker, measured in decibels, varies inversely as the square of your distance from the speaker. When you are 8 feet from the speaker, the loudness is 28 decibels. What is the loudness when you are 4 feet from the speaker? 72. The time required to assemble computers varies directly as the number of computers assembled and inversely as…arrow_forwardThe bar graph shows the average cost of tuition and fees at private four-year colleges in a particular country. Below are two mathematical models for the data shown in the graph. In each formula, T represents the average cost of tuition and fees at private colleges for the school year ending x years after 2000. Answer parts a and b. Average Cost of Tuition and Fees at Private Four-Year Colleges 22 20- 22,051 21,057 20,095 19,128 18,135 18- 16.203 16 15 218 17,168 Model 1 T= 974x+ 15,223 Model 2 T= - 2.1x + 988x + 15,208 14 2000 2001 20022003 2004 2005 2006 2007 a. Use each model to find the average cost of tuition and fees at private colleges for the school vear ending in 2003. By how much does each model underestimate or overestimate the actual cost shown for the school year ending in 2003? HIHE The average cost given by model 1 is $ Round to the nearest dollar.) Help Me Solve This Textbook Get More Help - Clear All Skill Builder Check Answer 10.19 PM 65°F 9/6/2021 Type here to search…arrow_forwardSuppose classmates who graduated in 2004 compared their median incomes ten years later. The bar graph displays the median income, in thousands of dollars, for each classmate during the time intervals from 2005‑2009 and 2010‑2014. For the individual with the largest dollar value increase in median income over the two time intervals, determine the amount of increase.arrow_forward
- Q. Table gives data on gold prices, the Consumer Price Index (CPI), and the New York Stock Exchange (NYSE) Index for the United States for the period 1974 –2006. The NYSE Index includes most of the stocks listed on the NYSE, some 1500-plus. a. Plot in the same scattergram gold prices, CPI, and the NYSE Index. b. An investment is supposed to be a hedge against inflation if its price and /or rate of return at least keeps pace with inflation. To test this hypothesis, suppose you decide to fit the following model, assuming the scatterplot in (a) suggests that this is appropriate: Gold pricet = β1 + β2 CPIt + ut NYSE indext = β1 + β2 CPIt + ut Note that if beta2 = 1 the response exactly grows with CPI Thank you!arrow_forwardSection E plsarrow_forward2. Draw diagrams to represent the following situations. a. The amount of flour that the bakery used this month was a 50% increase relative to last month. b. The amount of milk that the bakery used this month was a 75% decrease relative to last month.arrow_forward
- QUESTION 2 Over time, the number of Americans celebrating Halloween has increased. The bar graph below shows how many Americans celebrated Halloween (measured in millions of people) each year from 2012 through 2018. Celebration of Halloween by Year 185 ll 180 O 175 170 ( 165 + 160 > 155 150 145 2012 2013 2014 2015 2016 2017 2018 Year Use the bar graph to answer the following questions. a. How many Americans celebrated Halloween in 2018? b. In which year did the fewest number of Americans celebrate Halloween? c. In which year did approximately 162,000,000 Americans celebrate Halloween? d. Is this bar graph a Pareto Chart? Millions of Americansarrow_forwardA colony of ants starts with an initial population of 50 and doubles every week for 2 months. a) Create a table of values for weeks 0 to 8 for the population of the colony. b) Graph the data from your table of values. c) Is the relationship between the ant population and the number of weeks exponential? Explain. d) Model the information using an equation.arrow_forwardThe following bar graph shows the profits or losses for a small retail store in its first year of operation. Use the graph to determine the number of months in which the store had a profit. Profit and Loss for Retail Store 8000 W. 6000 - 4000 – 2000 – -2000 - -4000- Jan Feb Mar Apr May June July Aug Sep Oct Nov Dec Month 6. Profit or Loss (in Dollars)arrow_forward
arrow_back_ios
SEE MORE QUESTIONS
arrow_forward_ios
Recommended textbooks for you
 Algebra & Trigonometry with Analytic GeometryAlgebraISBN:9781133382119Author:SwokowskiPublisher:Cengage
 Big Ideas Math A Bridge To Success Algebra 1: Stu...AlgebraISBN:9781680331141Author:HOUGHTON MIFFLIN HARCOURTPublisher:Houghton Mifflin Harcourt
Algebra & Trigonometry with Analytic Geometry
Algebra
ISBN:9781133382119
Author:Swokowski
Publisher:Cengage
Big Ideas Math A Bridge To Success Algebra 1: Stu...
Algebra
ISBN:9781680331141
Author:HOUGHTON MIFFLIN HARCOURT
Publisher:Houghton Mifflin Harcourt
2.1 Introduction to inequalities; Author: Oli Notes;https://www.youtube.com/watch?v=D6erN5YTlXE;License: Standard YouTube License, CC-BY
GCSE Maths - What are Inequalities? (Inequalities Part 1) #56; Author: Cognito;https://www.youtube.com/watch?v=e_tY6X5PwWw;License: Standard YouTube License, CC-BY
Introduction to Inequalities | Inequality Symbols | Testing Solutions for Inequalities; Author: Scam Squad Math;https://www.youtube.com/watch?v=paZSN7sV1R8;License: Standard YouTube License, CC-BY