DEVELOP.MATH(3 VOLS) CUSTOM-W/MML <IC<
16th Edition
ISBN: 9781323235911
Author: BITTINGER
Publisher: Pearson Custom Publishing
expand_more
expand_more
format_list_bulleted
Concept explainers
Videos
Question
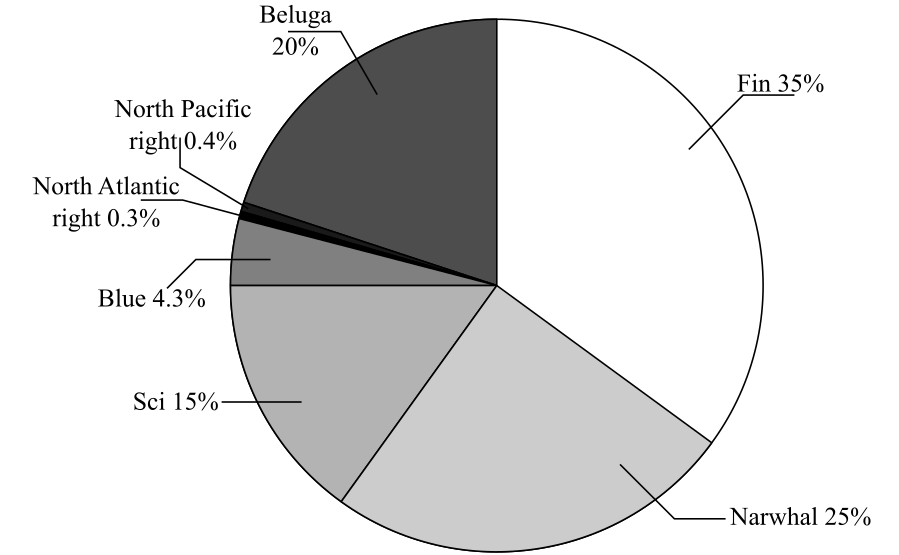
Chapter 5.4, Problem 1DE
To determine
The species accounts for
Expert Solution & Answer
Want to see the full answer?
Check out a sample textbook solution
Students have asked these similar questions
Exercises 83–86: The table lists data that are exactly linear.
a. Find the slope-intercept form of the line that passes through these
data points.
b. Predict y when x = -2.7 and 6.3. Decide if these calculations
involve interpolation or extrapolation.
-3
-2
-1
1
83.
y
-7.7
-6.2
-4.7
-3.2
-1.7
Suppose classmates who graduated in 2004 compared their median incomes ten years later. The bar graph displays the median income, in thousands of dollars, for each classmate during the time intervals from 2005‑2009 and 2010‑2014.
For the individual with the largest dollar value increase in median income over the two time intervals, determine the amount of increase.
The line graphs in Figure show the percentages of marriages ending in divorce based on the wife’s age at marriage.Here are two mathematical models that approximate the data displayed by the line graphs:In each model, the variable n is the number of years after marriage and the variable d is the percentage of marriages ending in divorce.a. Use the appropriate formula to determine the percentage of marriagesending in divorce after 10 years when the wife is over 25 at the time ofmarriage.b. Use the appropriate line graph in Figure to determine the percentageof marriages ending in divorce after 10 years when the wife is over 25 at the time of marriage.c. Does the value given by the mathematical model underestimate or overestimate the actual percentage of marriages ending in divorce after10 years as shown by the graph? By how much?
Chapter 5 Solutions
DEVELOP.MATH(3 VOLS) CUSTOM-W/MML <IC<
Ch. 5.1 - Objectives 1.6c and 3.4c:Simplify expressions...Ch. 5.1 - Prob. 2SRCh. 5.1 - Prob. 1DECh. 5.1 - Prob. 2DECh. 5.1 - Prob. 3DECh. 5.1 - Prob. 4DECh. 5.1 - GS Sohas sociology professor included the...Ch. 5.1 - Prob. 6DECh. 5.1 - Prob. 7DECh. 5.1 - Prob. 8DE
Ch. 5.1 - Prob. 9DECh. 5.1 - Prob. 10DECh. 5.1 - Prob. 11DECh. 5.1 - Prob. 12DECh. 5.1 - Prob. 13DECh. 5.1 - Prob. 14DECh. 5.1 - Prob. 15DECh. 5.1 - 16. In a lab, Gina determined the mass, in grams,...Ch. 5.1 - Prob. 1RCCh. 5.1 - Prob. 2RCCh. 5.1 - Prob. 3RCCh. 5.1 - Prob. 4RCCh. 5.1 - Prob. 1ESCh. 5.1 - Prob. 2ESCh. 5.1 - Prob. 3ESCh. 5.1 - Prob. 4ESCh. 5.1 - Prob. 5ESCh. 5.1 - Prob. 6ESCh. 5.1 - Prob. 7ESCh. 5.1 - Prob. 8ESCh. 5.1 - Prob. 9ESCh. 5.1 - Prob. 10ESCh. 5.1 - Prob. 11ESCh. 5.1 - Prob. 12ESCh. 5.1 - Prob. 13ESCh. 5.1 - Prob. 14ESCh. 5.1 - Prob. 15ESCh. 5.1 - Prob. 16ESCh. 5.1 - Grading. To get a B in math, Rich must score an...Ch. 5.1 - Prob. 18ESCh. 5.1 - Prob. 19ESCh. 5.1 - Prob. 20ESCh. 5.1 - Median Home Prices. The following table lists the...Ch. 5.1 - Prob. 22ESCh. 5.1 - Movie Ticket Sales. The following table lists the...Ch. 5.1 - Prob. 24ESCh. 5.1 - Prob. 25ESCh. 5.1 - Prob. 26ESCh. 5.1 - Prob. 27ESCh. 5.1 - Prob. 28ESCh. 5.1 - Prob. 29ESCh. 5.1 - Prob. 30ESCh. 5.1 - Prob. 31ESCh. 5.2 - Objective 2.4d: Multiply using mixed numerals....Ch. 5.2 - Prob. 2SRCh. 5.2 - Use the table in Example 1 to answer Margin...Ch. 5.2 - Prob. 2DECh. 5.2 - Prob. 3DECh. 5.2 - Prob. 4DECh. 5.2 - Prob. 5DECh. 5.2 - Prob. 6DECh. 5.2 - Prob. 7DECh. 5.2 - Prob. 8DECh. 5.2 - Prob. 9DECh. 5.2 - Prob. 10DECh. 5.2 - Prob. 11DECh. 5.2 - Prob. 12DECh. 5.2 - Prob. 13DECh. 5.2 - Prob. 14DECh. 5.2 - Prob. 15DECh. 5.2 - Prob. 1RCCh. 5.2 - Prob. 2RCCh. 5.2 - Prob. 3RCCh. 5.2 - Prob. 4RCCh. 5.2 - Prob. 1ESCh. 5.2 - Prob. 2ESCh. 5.2 - Prob. 3ESCh. 5.2 - Prob. 4ESCh. 5.2 - Prob. 5ESCh. 5.2 - Prob. 6ESCh. 5.2 - Prob. 7ESCh. 5.2 - Prob. 8ESCh. 5.2 - Prob. 9ESCh. 5.2 - Prob. 10ESCh. 5.2 - Prob. 11ESCh. 5.2 - Prob. 12ESCh. 5.2 - Prob. 13ESCh. 5.2 - Prob. 14ESCh. 5.2 - Prob. 15ESCh. 5.2 - Prob. 16ESCh. 5.2 - Prob. 17ESCh. 5.2 - Prob. 18ESCh. 5.2 - Prob. 19ESCh. 5.2 - Prob. 20ESCh. 5.2 - Prob. 21ESCh. 5.2 - Prob. 22ESCh. 5.2 - Prob. 23ESCh. 5.2 - Prob. 24ESCh. 5.2 - Prob. 25ESCh. 5.2 - Prob. 26ESCh. 5.2 - Prob. 27ESCh. 5.2 - Prob. 28ESCh. 5.2 - Prob. 29ESCh. 5.2 - Prob. 30ESCh. 5.2 - Prob. 31ESCh. 5.2 - Prob. 32ESCh. 5.2 - Prob. 33ESCh. 5.2 - Prob. 34ESCh. 5.2 - Prob. 35ESCh. 5.2 - Prob. 36ESCh. 5.2 - Prob. 37ESCh. 5.2 - Prob. 38ESCh. 5.2 - Personal Consumption Expenditures. The following...Ch. 5.2 - Personal Consumption Expenditures. The following...Ch. 5.2 - Prob. 41ESCh. 5.2 - Prob. 42ESCh. 5.2 - Prob. 43ESCh. 5.2 - Prob. 44ESCh. 5.2 - Prob. 1MCRCh. 5.2 - Prob. 2MCRCh. 5.2 - Prob. 3MCRCh. 5.2 - Prob. 4MCRCh. 5.2 - Prob. 5MCRCh. 5.2 - Prob. 6MCRCh. 5.2 - Prob. 7MCRCh. 5.2 - Prob. 8MCRCh. 5.2 - Prob. 9MCRCh. 5.2 - Prob. 10MCRCh. 5.2 - Prob. 11MCRCh. 5.2 - Prob. 12MCRCh. 5.2 - Prob. 13MCRCh. 5.2 - Prob. 14MCRCh. 5.2 - Prob. 15MCRCh. 5.2 - Prob. 16MCRCh. 5.2 - Downsizing. Companies sometimes downsize their...Ch. 5.2 - Prob. 18MCRCh. 5.2 - Prob. 19MCRCh. 5.2 - Prob. 20MCRCh. 5.2 - Prob. 21MCRCh. 5.2 - Prob. 22MCRCh. 5.2 - Prob. 23UTDWCh. 5.2 - Answers to Exercises 23 and 24 can be found on...Ch. 5.3 - Objective 3.1c: Given a pair of numbers in decimal...Ch. 5.3 - Objective 3.1c: Given a pair of numbers in decimal...Ch. 5.3 - Prob. 1DECh. 5.3 - Prob. 2DECh. 5.3 - Prob. 3DECh. 5.3 - Prob. 4DECh. 5.3 - Prob. 5DECh. 5.3 - Prob. 6DECh. 5.3 - Prob. 7DECh. 5.3 - Prob. 8DECh. 5.3 - Prob. 1RCCh. 5.3 - Prob. 2RCCh. 5.3 - Prob. 3RCCh. 5.3 - Prob. 4RCCh. 5.3 - Prob. 1ESCh. 5.3 - Prob. 2ESCh. 5.3 - Prob. 3ESCh. 5.3 - Prob. 4ESCh. 5.3 - Prob. 5ESCh. 5.3 - Prob. 6ESCh. 5.3 - Prob. 7ESCh. 5.3 - Prob. 8ESCh. 5.3 - Prob. 9ESCh. 5.3 - Prob. 10ESCh. 5.3 - Prob. 11ESCh. 5.3 - Prob. 12ESCh. 5.3 - Prob. 13ESCh. 5.3 - Prob. 14ESCh. 5.3 - Prob. 15ESCh. 5.3 - Prob. 16ESCh. 5.3 - Prob. 17ESCh. 5.3 - Prob. 18ESCh. 5.3 - Prob. 19ESCh. 5.3 - Prob. 20ESCh. 5.3 - Prob. 21ESCh. 5.3 - Prob. 22ESCh. 5.3 - Prob. 23ESCh. 5.3 - Prob. 24ESCh. 5.3 - Prob. 25ESCh. 5.3 - Prob. 26ESCh. 5.3 - Prob. 27ESCh. 5.3 - Prob. 28ESCh. 5.3 - Prob. 29ESCh. 5.3 - Prob. 30ESCh. 5.3 - Prob. 31ESCh. 5.3 - Prob. 32ESCh. 5.3 - Prob. 33ESCh. 5.3 - Prob. 34ESCh. 5.3 - Prob. 35ESCh. 5.3 - Prob. 36ESCh. 5.3 - Prob. 37ESCh. 5.3 - Prob. 38ESCh. 5.3 - Prob. 39ESCh. 5.3 - Prob. 40ESCh. 5.3 - Prob. 41ESCh. 5.3 - Prob. 42ESCh. 5.3 - Prob. 43ESCh. 5.3 - Prob. 44ESCh. 5.3 - Prob. 45ESCh. 5.3 - Prob. 46ESCh. 5.3 - Prob. 47ESCh. 5.3 - Prob. 48ESCh. 5.3 - Prob. 49ESCh. 5.3 - Prob. 50ESCh. 5.3 - Prob. 51ESCh. 5.3 - Prob. 52ESCh. 5.3 - Prob. 53ESCh. 5.3 - Prob. 54ESCh. 5.3 - Prob. 55ESCh. 5.3 - Prob. 56ESCh. 5.3 - Prob. 57ESCh. 5.3 - Prob. 58ESCh. 5.3 - Prob. 59ESCh. 5.3 - Prob. 60ESCh. 5.4 - Objective 4.3a: Convert from fraction notation to...Ch. 5.4 - Prob. 2SRCh. 5.4 - Prob. 1DECh. 5.4 - Prob. 2DECh. 5.4 - Prob. 3DECh. 5.4 - Prob. 4DECh. 5.4 - Prob. 1TFSCh. 5.4 - Prob. 2TFSCh. 5.4 - Prob. 3TFSCh. 5.4 - Prob. 4TFSCh. 5.4 - Prob. 5TFSCh. 5.4 - The goal of these matching questions is to...Ch. 5.4 - Prob. 7TFSCh. 5.4 - Prob. 8TFSCh. 5.4 - Prob. 9TFSCh. 5.4 - Prob. 10TFSCh. 5.4 - Prob. 1RCCh. 5.4 - Prob. 2RCCh. 5.4 - Prob. 3RCCh. 5.4 - Prob. 4RCCh. 5.4 - Prob. 5RCCh. 5.4 - Prob. 6RCCh. 5.4 - Prob. 1ESCh. 5.4 - Prob. 2ESCh. 5.4 - Prob. 3ESCh. 5.4 - Prob. 4ESCh. 5.4 - Prob. 5ESCh. 5.4 - Prob. 6ESCh. 5.4 - Prob. 7ESCh. 5.4 - Prob. 8ESCh. 5.4 - Prob. 9ESCh. 5.4 - Prob. 10ESCh. 5 - Complete each statement with the correct term from...Ch. 5 - Prob. 2VRCh. 5 - Prob. 3VRCh. 5 - Prob. 4VRCh. 5 - Prob. 5VRCh. 5 - Prob. 6VRCh. 5 - Prob. 1CORCh. 5 - Prob. 2CORCh. 5 - Prob. 3CORCh. 5 - Prob. 1SGPECh. 5 - 2. Use the table in the example shown above for...Ch. 5 - Which oatmeal has the greatest cost per serving?...Ch. 5 - Prob. 4SGPECh. 5 - Prob. 5SGPECh. 5 - Prob. 6SGPECh. 5 - Use the circle graph at left to answer Exercises 7...Ch. 5 - Use the circle graph at left to answer Exercises 7...Ch. 5 - Prob. 1RECh. 5 - Prob. 2RECh. 5 - Prob. 3RECh. 5 - Prob. 4RECh. 5 - Prob. 5RECh. 5 - Prob. 6RECh. 5 - Prob. 7RECh. 5 - Gas Mileage. A 2012 Mazda Miata does 336 mi of...Ch. 5 - Prob. 9RECh. 5 - Prob. 10RECh. 5 - Prob. 11RECh. 5 - Prob. 12RECh. 5 - Prob. 13RECh. 5 - Prob. 14RECh. 5 - Prob. 15RECh. 5 - Prob. 16RECh. 5 - Prob. 17RECh. 5 - Prob. 18RECh. 5 - Prob. 19RECh. 5 - Prob. 20RECh. 5 - Prob. 21RECh. 5 - Prob. 22RECh. 5 - Prob. 23RECh. 5 - Prob. 24RECh. 5 - Prob. 25RECh. 5 - Prob. 26RECh. 5 - Major League World Series. Except for four years,...Ch. 5 - Prob. 28RECh. 5 - Prob. 29RECh. 5 - Prob. 30RECh. 5 - Prob. 31RECh. 5 - Prob. 32RECh. 5 - Prob. 33RECh. 5 - Prob. 34RECh. 5 - Prob. 35RECh. 5 - Prob. 36RECh. 5 - Prob. 37RECh. 5 - Prob. 38RECh. 5 - Prob. 39RECh. 5 - Prob. 40RECh. 5 - Prob. 41RECh. 5 - Prob. 42RECh. 5 - Prob. 43RECh. 5 - Prob. 44RECh. 5 - Prob. 45RECh. 5 - What is the average of this set of data?...Ch. 5 - Prob. 47RECh. 5 - Prob. 48RECh. 5 - Prob. 49RECh. 5 - Prob. 50RECh. 5 - Prob. 1UTDWCh. 5 - Prob. 2UTDWCh. 5 - Prob. 3UTDWCh. 5 - Prob. 4UTDWCh. 5 - Prob. 5UTDWCh. 5 - Prob. 6UTDWCh. 5 - Prob. 1TCh. 5 - Prob. 2TCh. 5 - Prob. 3TCh. 5 - Prob. 4TCh. 5 - Prob. 5TCh. 5 - Prob. 6TCh. 5 - Prob. 7TCh. 5 - Prob. 8TCh. 5 - Prob. 9TCh. 5 - Prob. 10TCh. 5 - Prob. 11TCh. 5 - Prob. 12TCh. 5 - Prob. 13TCh. 5 - Prob. 14TCh. 5 - Prob. 15TCh. 5 - Prob. 16TCh. 5 - Prob. 17TCh. 5 - Prob. 18TCh. 5 - Prob. 19TCh. 5 - Prob. 20TCh. 5 - Prob. 21TCh. 5 - Prob. 22TCh. 5 - Prob. 23TCh. 5 - Prob. 24TCh. 5 - Prob. 25TCh. 5 - 26. Referring to Exercise 25, consider a family...
Knowledge Booster


Learn more about
Need a deep-dive on the concept behind this application? Look no further. Learn more about this topic, subject and related others by exploring similar questions and additional content below.Similar questions
- easure.arrow_forwardExample 16. The average daily wage of all workers in a factory is 444. If the average daily wages paid to male and female workers are 480 to 360 respectively, find the percentage of male and female workers employed by the factory.arrow_forwardU.S. Population The number of White non-Hispanicindividuals in the U.S. civilian non-institutional population 16 years and older was 153.1 million in 2000and is projected to be 169.4 million in 2050.(Source: U.S. Census Bureau)a. Find the average annual rate of change in population during the period 2000–2050, with the appropriate units.b. Use the slope from part (a) and the population in2000 to write the equation of the line associatedwith 2000 and 2050.c. What does this model project the population to bein 2020?arrow_forward
- Chap 6 13arrow_forwardThe figure below shows a plot of Healthcare Expenditure per capita in 2019 and Life Expectancy according to data sourced from the World Bank with regions around the world being colour-coded (e.g. Australia, which is in Oceania, has health expenditure per capita of $5,427 and life expectancy of 83.2 years). In no more than 200 words, describe the patterns that you see in this figure.arrow_forwardSo I'll include a line graph for a second visual aid. I have a chart to show the proportion of students by major that have student loan debt at our school.arrow_forward
- D, E and F please, thank you!arrow_forwardAmericans' trust in government and the media has generally been on a downward trend since pollsters first asked questions on these topics in the second half of the twentieth century. Trust in government hit an all-time low of 14% in 2014, while trust in the media bottomed out at 32% in 2016. The bar graph shows the percentage of Americans trusting in the government and the media for five selected years. Use this information to answer parts a-c. a. Use the information in the graph to estimate the yearly loss in the percentage of people trusting in government. The yearly loss in the percentage of people trusting in government is 36 %. (Round to the nearest tenth as needed.) b. Write a mathematical model that estimates the percentage, P, of people trusting in government x years after 2003. The mathematical model P = estimates the percentage, P, of people trusting in government x years after 2003. (Use integers or decimals for any numbers in the expression. Use the answer from part (a) to…arrow_forwardThe table shows the historical in-state tuition rates for the University of Kalamazoo. Use the data to answer the questions and round your answers to two decimal places. Academic year Rate of tuition for one semester 2008–2009 $3,812 2009–2010 $4,002 2010–2011 $4,441 2011–2012 $4,905 2012–2013 $5,181 What is the percentage increase in tuition from the 2008–2009 school year to the 2012–2013 school year?arrow_forward
- The following table shows the length, in centimeters, of the humerus and the total wingspan, in centimeters, of several pterosaurs, which are extinct flying reptiles.arrow_forwardThe following bar graph shows the profits or losses for a small retail store in its first year of operation. Use the graph to determine the number of months in which the store had a profit. Profit and Loss for Retail Store 8000 W. 6000 - 4000 – 2000 – -2000 - -4000- Jan Feb Mar Apr May June July Aug Sep Oct Nov Dec Month 6. Profit or Loss (in Dollars)arrow_forwardQuestion A. Which vehicle arrived at Dallas first? How long did it take? B. How many miles did each vehicle travel at a proportional rate? Explainarrow_forward
arrow_back_ios
SEE MORE QUESTIONS
arrow_forward_ios
Recommended textbooks for you
 Glencoe Algebra 1, Student Edition, 9780079039897...AlgebraISBN:9780079039897Author:CarterPublisher:McGraw Hill
 Holt Mcdougal Larson Pre-algebra: Student Edition...AlgebraISBN:9780547587776Author:HOLT MCDOUGALPublisher:HOLT MCDOUGAL
 Big Ideas Math A Bridge To Success Algebra 1: Stu...AlgebraISBN:9781680331141Author:HOUGHTON MIFFLIN HARCOURTPublisher:Houghton Mifflin Harcourt
 Algebra: Structure And Method, Book 1AlgebraISBN:9780395977224Author:Richard G. Brown, Mary P. Dolciani, Robert H. Sorgenfrey, William L. ColePublisher:McDougal Littell
Glencoe Algebra 1, Student Edition, 9780079039897...
Algebra
ISBN:9780079039897
Author:Carter
Publisher:McGraw Hill
Holt Mcdougal Larson Pre-algebra: Student Edition...
Algebra
ISBN:9780547587776
Author:HOLT MCDOUGAL
Publisher:HOLT MCDOUGAL
Big Ideas Math A Bridge To Success Algebra 1: Stu...
Algebra
ISBN:9781680331141
Author:HOUGHTON MIFFLIN HARCOURT
Publisher:Houghton Mifflin Harcourt
Algebra: Structure And Method, Book 1
Algebra
ISBN:9780395977224
Author:Richard G. Brown, Mary P. Dolciani, Robert H. Sorgenfrey, William L. Cole
Publisher:McDougal Littell
Which is the best chart: Selecting among 14 types of charts Part II; Author: 365 Data Science;https://www.youtube.com/watch?v=qGaIB-bRn-A;License: Standard YouTube License, CC-BY