DEVELOP.MATH(3 VOLS) CUSTOM-W/MML <IC<
16th Edition
ISBN: 9781323235911
Author: BITTINGER
Publisher: Pearson Custom Publishing
expand_more
expand_more
format_list_bulleted
Concept explainers
Videos
Question
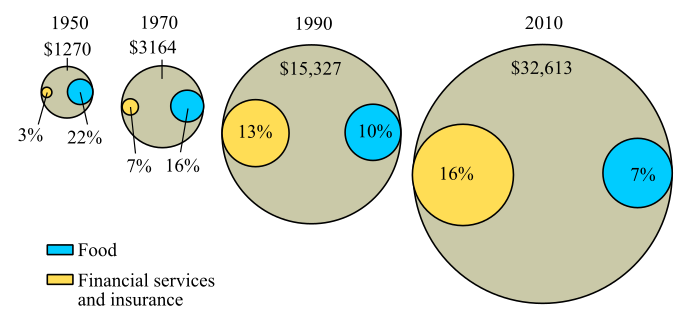
Chapter 5.2, Problem 36ES
To determine
The years in which more money is spent on financial services and insurance than that of food from the graph given beklow,
Expert Solution & Answer
Want to see the full answer?
Check out a sample textbook solution
Students have asked these similar questions
Complete the following table: LU 6-2(3)
6–50.
6–51.
TABLE 1.5
The amount of money expended in fiscal year 2009 by the U.S. Department of Defense
in various categories is shown in Table 1.5.5 Construct both a pie chart and a bar chart
to describe the data. Compare the two forms of presentation.
Expenses by Category
Category
Amount ($ billions)
Military personnel
147.3
Operation and maintenance
259.3
Procurement
129.2
Research and development
79.0
Military construction
17.6
Other
4.3
Total
636.7
Source: The World Almanac and Book of Facts 2011
A teller's hourly wage for various years is represented in the table below.
Year
Hourly Wage
2015
$22.50
2016
$24.00
2017
$27.60
What was the hourly wage percent of change from 2016 to 2017? Be sure to state if it was a percent increase or percent decrease.
%
Chapter 5 Solutions
DEVELOP.MATH(3 VOLS) CUSTOM-W/MML <IC<
Ch. 5.1 - Objectives 1.6c and 3.4c:Simplify expressions...Ch. 5.1 - Prob. 2SRCh. 5.1 - Prob. 1DECh. 5.1 - Prob. 2DECh. 5.1 - Prob. 3DECh. 5.1 - Prob. 4DECh. 5.1 - GS Sohas sociology professor included the...Ch. 5.1 - Prob. 6DECh. 5.1 - Prob. 7DECh. 5.1 - Prob. 8DE
Ch. 5.1 - Prob. 9DECh. 5.1 - Prob. 10DECh. 5.1 - Prob. 11DECh. 5.1 - Prob. 12DECh. 5.1 - Prob. 13DECh. 5.1 - Prob. 14DECh. 5.1 - Prob. 15DECh. 5.1 - 16. In a lab, Gina determined the mass, in grams,...Ch. 5.1 - Prob. 1RCCh. 5.1 - Prob. 2RCCh. 5.1 - Prob. 3RCCh. 5.1 - Prob. 4RCCh. 5.1 - Prob. 1ESCh. 5.1 - Prob. 2ESCh. 5.1 - Prob. 3ESCh. 5.1 - Prob. 4ESCh. 5.1 - Prob. 5ESCh. 5.1 - Prob. 6ESCh. 5.1 - Prob. 7ESCh. 5.1 - Prob. 8ESCh. 5.1 - Prob. 9ESCh. 5.1 - Prob. 10ESCh. 5.1 - Prob. 11ESCh. 5.1 - Prob. 12ESCh. 5.1 - Prob. 13ESCh. 5.1 - Prob. 14ESCh. 5.1 - Prob. 15ESCh. 5.1 - Prob. 16ESCh. 5.1 - Grading. To get a B in math, Rich must score an...Ch. 5.1 - Prob. 18ESCh. 5.1 - Prob. 19ESCh. 5.1 - Prob. 20ESCh. 5.1 - Median Home Prices. The following table lists the...Ch. 5.1 - Prob. 22ESCh. 5.1 - Movie Ticket Sales. The following table lists the...Ch. 5.1 - Prob. 24ESCh. 5.1 - Prob. 25ESCh. 5.1 - Prob. 26ESCh. 5.1 - Prob. 27ESCh. 5.1 - Prob. 28ESCh. 5.1 - Prob. 29ESCh. 5.1 - Prob. 30ESCh. 5.1 - Prob. 31ESCh. 5.2 - Objective 2.4d: Multiply using mixed numerals....Ch. 5.2 - Prob. 2SRCh. 5.2 - Use the table in Example 1 to answer Margin...Ch. 5.2 - Prob. 2DECh. 5.2 - Prob. 3DECh. 5.2 - Prob. 4DECh. 5.2 - Prob. 5DECh. 5.2 - Prob. 6DECh. 5.2 - Prob. 7DECh. 5.2 - Prob. 8DECh. 5.2 - Prob. 9DECh. 5.2 - Prob. 10DECh. 5.2 - Prob. 11DECh. 5.2 - Prob. 12DECh. 5.2 - Prob. 13DECh. 5.2 - Prob. 14DECh. 5.2 - Prob. 15DECh. 5.2 - Prob. 1RCCh. 5.2 - Prob. 2RCCh. 5.2 - Prob. 3RCCh. 5.2 - Prob. 4RCCh. 5.2 - Prob. 1ESCh. 5.2 - Prob. 2ESCh. 5.2 - Prob. 3ESCh. 5.2 - Prob. 4ESCh. 5.2 - Prob. 5ESCh. 5.2 - Prob. 6ESCh. 5.2 - Prob. 7ESCh. 5.2 - Prob. 8ESCh. 5.2 - Prob. 9ESCh. 5.2 - Prob. 10ESCh. 5.2 - Prob. 11ESCh. 5.2 - Prob. 12ESCh. 5.2 - Prob. 13ESCh. 5.2 - Prob. 14ESCh. 5.2 - Prob. 15ESCh. 5.2 - Prob. 16ESCh. 5.2 - Prob. 17ESCh. 5.2 - Prob. 18ESCh. 5.2 - Prob. 19ESCh. 5.2 - Prob. 20ESCh. 5.2 - Prob. 21ESCh. 5.2 - Prob. 22ESCh. 5.2 - Prob. 23ESCh. 5.2 - Prob. 24ESCh. 5.2 - Prob. 25ESCh. 5.2 - Prob. 26ESCh. 5.2 - Prob. 27ESCh. 5.2 - Prob. 28ESCh. 5.2 - Prob. 29ESCh. 5.2 - Prob. 30ESCh. 5.2 - Prob. 31ESCh. 5.2 - Prob. 32ESCh. 5.2 - Prob. 33ESCh. 5.2 - Prob. 34ESCh. 5.2 - Prob. 35ESCh. 5.2 - Prob. 36ESCh. 5.2 - Prob. 37ESCh. 5.2 - Prob. 38ESCh. 5.2 - Personal Consumption Expenditures. The following...Ch. 5.2 - Personal Consumption Expenditures. The following...Ch. 5.2 - Prob. 41ESCh. 5.2 - Prob. 42ESCh. 5.2 - Prob. 43ESCh. 5.2 - Prob. 44ESCh. 5.2 - Prob. 1MCRCh. 5.2 - Prob. 2MCRCh. 5.2 - Prob. 3MCRCh. 5.2 - Prob. 4MCRCh. 5.2 - Prob. 5MCRCh. 5.2 - Prob. 6MCRCh. 5.2 - Prob. 7MCRCh. 5.2 - Prob. 8MCRCh. 5.2 - Prob. 9MCRCh. 5.2 - Prob. 10MCRCh. 5.2 - Prob. 11MCRCh. 5.2 - Prob. 12MCRCh. 5.2 - Prob. 13MCRCh. 5.2 - Prob. 14MCRCh. 5.2 - Prob. 15MCRCh. 5.2 - Prob. 16MCRCh. 5.2 - Downsizing. Companies sometimes downsize their...Ch. 5.2 - Prob. 18MCRCh. 5.2 - Prob. 19MCRCh. 5.2 - Prob. 20MCRCh. 5.2 - Prob. 21MCRCh. 5.2 - Prob. 22MCRCh. 5.2 - Prob. 23UTDWCh. 5.2 - Answers to Exercises 23 and 24 can be found on...Ch. 5.3 - Objective 3.1c: Given a pair of numbers in decimal...Ch. 5.3 - Objective 3.1c: Given a pair of numbers in decimal...Ch. 5.3 - Prob. 1DECh. 5.3 - Prob. 2DECh. 5.3 - Prob. 3DECh. 5.3 - Prob. 4DECh. 5.3 - Prob. 5DECh. 5.3 - Prob. 6DECh. 5.3 - Prob. 7DECh. 5.3 - Prob. 8DECh. 5.3 - Prob. 1RCCh. 5.3 - Prob. 2RCCh. 5.3 - Prob. 3RCCh. 5.3 - Prob. 4RCCh. 5.3 - Prob. 1ESCh. 5.3 - Prob. 2ESCh. 5.3 - Prob. 3ESCh. 5.3 - Prob. 4ESCh. 5.3 - Prob. 5ESCh. 5.3 - Prob. 6ESCh. 5.3 - Prob. 7ESCh. 5.3 - Prob. 8ESCh. 5.3 - Prob. 9ESCh. 5.3 - Prob. 10ESCh. 5.3 - Prob. 11ESCh. 5.3 - Prob. 12ESCh. 5.3 - Prob. 13ESCh. 5.3 - Prob. 14ESCh. 5.3 - Prob. 15ESCh. 5.3 - Prob. 16ESCh. 5.3 - Prob. 17ESCh. 5.3 - Prob. 18ESCh. 5.3 - Prob. 19ESCh. 5.3 - Prob. 20ESCh. 5.3 - Prob. 21ESCh. 5.3 - Prob. 22ESCh. 5.3 - Prob. 23ESCh. 5.3 - Prob. 24ESCh. 5.3 - Prob. 25ESCh. 5.3 - Prob. 26ESCh. 5.3 - Prob. 27ESCh. 5.3 - Prob. 28ESCh. 5.3 - Prob. 29ESCh. 5.3 - Prob. 30ESCh. 5.3 - Prob. 31ESCh. 5.3 - Prob. 32ESCh. 5.3 - Prob. 33ESCh. 5.3 - Prob. 34ESCh. 5.3 - Prob. 35ESCh. 5.3 - Prob. 36ESCh. 5.3 - Prob. 37ESCh. 5.3 - Prob. 38ESCh. 5.3 - Prob. 39ESCh. 5.3 - Prob. 40ESCh. 5.3 - Prob. 41ESCh. 5.3 - Prob. 42ESCh. 5.3 - Prob. 43ESCh. 5.3 - Prob. 44ESCh. 5.3 - Prob. 45ESCh. 5.3 - Prob. 46ESCh. 5.3 - Prob. 47ESCh. 5.3 - Prob. 48ESCh. 5.3 - Prob. 49ESCh. 5.3 - Prob. 50ESCh. 5.3 - Prob. 51ESCh. 5.3 - Prob. 52ESCh. 5.3 - Prob. 53ESCh. 5.3 - Prob. 54ESCh. 5.3 - Prob. 55ESCh. 5.3 - Prob. 56ESCh. 5.3 - Prob. 57ESCh. 5.3 - Prob. 58ESCh. 5.3 - Prob. 59ESCh. 5.3 - Prob. 60ESCh. 5.4 - Objective 4.3a: Convert from fraction notation to...Ch. 5.4 - Prob. 2SRCh. 5.4 - Prob. 1DECh. 5.4 - Prob. 2DECh. 5.4 - Prob. 3DECh. 5.4 - Prob. 4DECh. 5.4 - Prob. 1TFSCh. 5.4 - Prob. 2TFSCh. 5.4 - Prob. 3TFSCh. 5.4 - Prob. 4TFSCh. 5.4 - Prob. 5TFSCh. 5.4 - The goal of these matching questions is to...Ch. 5.4 - Prob. 7TFSCh. 5.4 - Prob. 8TFSCh. 5.4 - Prob. 9TFSCh. 5.4 - Prob. 10TFSCh. 5.4 - Prob. 1RCCh. 5.4 - Prob. 2RCCh. 5.4 - Prob. 3RCCh. 5.4 - Prob. 4RCCh. 5.4 - Prob. 5RCCh. 5.4 - Prob. 6RCCh. 5.4 - Prob. 1ESCh. 5.4 - Prob. 2ESCh. 5.4 - Prob. 3ESCh. 5.4 - Prob. 4ESCh. 5.4 - Prob. 5ESCh. 5.4 - Prob. 6ESCh. 5.4 - Prob. 7ESCh. 5.4 - Prob. 8ESCh. 5.4 - Prob. 9ESCh. 5.4 - Prob. 10ESCh. 5 - Complete each statement with the correct term from...Ch. 5 - Prob. 2VRCh. 5 - Prob. 3VRCh. 5 - Prob. 4VRCh. 5 - Prob. 5VRCh. 5 - Prob. 6VRCh. 5 - Prob. 1CORCh. 5 - Prob. 2CORCh. 5 - Prob. 3CORCh. 5 - Prob. 1SGPECh. 5 - 2. Use the table in the example shown above for...Ch. 5 - Which oatmeal has the greatest cost per serving?...Ch. 5 - Prob. 4SGPECh. 5 - Prob. 5SGPECh. 5 - Prob. 6SGPECh. 5 - Use the circle graph at left to answer Exercises 7...Ch. 5 - Use the circle graph at left to answer Exercises 7...Ch. 5 - Prob. 1RECh. 5 - Prob. 2RECh. 5 - Prob. 3RECh. 5 - Prob. 4RECh. 5 - Prob. 5RECh. 5 - Prob. 6RECh. 5 - Prob. 7RECh. 5 - Gas Mileage. A 2012 Mazda Miata does 336 mi of...Ch. 5 - Prob. 9RECh. 5 - Prob. 10RECh. 5 - Prob. 11RECh. 5 - Prob. 12RECh. 5 - Prob. 13RECh. 5 - Prob. 14RECh. 5 - Prob. 15RECh. 5 - Prob. 16RECh. 5 - Prob. 17RECh. 5 - Prob. 18RECh. 5 - Prob. 19RECh. 5 - Prob. 20RECh. 5 - Prob. 21RECh. 5 - Prob. 22RECh. 5 - Prob. 23RECh. 5 - Prob. 24RECh. 5 - Prob. 25RECh. 5 - Prob. 26RECh. 5 - Major League World Series. Except for four years,...Ch. 5 - Prob. 28RECh. 5 - Prob. 29RECh. 5 - Prob. 30RECh. 5 - Prob. 31RECh. 5 - Prob. 32RECh. 5 - Prob. 33RECh. 5 - Prob. 34RECh. 5 - Prob. 35RECh. 5 - Prob. 36RECh. 5 - Prob. 37RECh. 5 - Prob. 38RECh. 5 - Prob. 39RECh. 5 - Prob. 40RECh. 5 - Prob. 41RECh. 5 - Prob. 42RECh. 5 - Prob. 43RECh. 5 - Prob. 44RECh. 5 - Prob. 45RECh. 5 - What is the average of this set of data?...Ch. 5 - Prob. 47RECh. 5 - Prob. 48RECh. 5 - Prob. 49RECh. 5 - Prob. 50RECh. 5 - Prob. 1UTDWCh. 5 - Prob. 2UTDWCh. 5 - Prob. 3UTDWCh. 5 - Prob. 4UTDWCh. 5 - Prob. 5UTDWCh. 5 - Prob. 6UTDWCh. 5 - Prob. 1TCh. 5 - Prob. 2TCh. 5 - Prob. 3TCh. 5 - Prob. 4TCh. 5 - Prob. 5TCh. 5 - Prob. 6TCh. 5 - Prob. 7TCh. 5 - Prob. 8TCh. 5 - Prob. 9TCh. 5 - Prob. 10TCh. 5 - Prob. 11TCh. 5 - Prob. 12TCh. 5 - Prob. 13TCh. 5 - Prob. 14TCh. 5 - Prob. 15TCh. 5 - Prob. 16TCh. 5 - Prob. 17TCh. 5 - Prob. 18TCh. 5 - Prob. 19TCh. 5 - Prob. 20TCh. 5 - Prob. 21TCh. 5 - Prob. 22TCh. 5 - Prob. 23TCh. 5 - Prob. 24TCh. 5 - Prob. 25TCh. 5 - 26. Referring to Exercise 25, consider a family...
Knowledge Booster


Learn more about
Need a deep-dive on the concept behind this application? Look no further. Learn more about this topic, subject and related others by exploring similar questions and additional content below.Similar questions
- Please answer percentage changes.arrow_forwardPlease help me dont do handwritten and explain evry concept explain everything..arrow_forwardWith aging, body fat increases and muscle mass declines. The line graphs show the percent body fat in adult females and males as they age from 25 to 75 years. Use this information to complete parts (a) through (c) below. a. Find an estimate for the percent body fat in 45-year-old females. % (Type a whole number.) Percent Body Fat 40 36- 32- 28- 24 20+ 15 Percent Body Fat in Adults 25 35 45 Age Females Males 55 65 75arrow_forward
- The accompanying table shows the earnings per share (in dollars) and the dividends per share (in dollars) for 6 companies in a recent year. Complete parts (a) through (d) below. Click here to view the data table. Earnings per share, x Dividends per share, y 1.2 0.95 4.3 0.38 3.58 2.4 8.56 1.12 1.92 0.75 3.17 1.43 Click here to view the table of critical values for the Pearson correlation coefficient. n alpha=0.05 alpha=0.014 0.95 0.995 0.878 0.9596 0.811 0.9177 0.754 0.8758 0.707 0.8349 0.666 0.79810 0.632 0.76511 0.602 0.73512 0.576 0.70813 0.553 0.68414 0.532 0.66115 0.514 0.64116 0.497 0.62317 0.482 0.60618 0.468 0.5919 0.456 0.57520 0.444 0.56121 0.433 0.54922 0.423 0.53723 0.413 0.52624 0.404 0.51525…arrow_forwardThe bar graph shows median yearly earnings of full-time workers in the United States for people 25 years and over with a college education, by final degree earned. (See the attached graph.) The median yearly salary of an American whose final degree is a master’s is $70 thousand less than twice that of an American whose final degree is a bachelor’s. Combined, two people with each of these educational attainments earn $173 thousand. Find the median yearly salary of Americans with each of these final degrees.arrow_forwardThe following table shows the length, in centimeters, of the humerus and the total wingspan, in centimeters, of several pterosaurs, which are extinct flying reptiles.arrow_forward
- Demographers are scientists who study trends in populations, including how the percent of people in different age groups changes over time. The table gives some information about the U.S. population in 2010. Answer questions 1dash–4 below. LOADING... Click the icon to view the population table. 1. Complete the table. Express the number of people in millions. U.S. Population (2010) Age Group Number of People (millions) Percent of Population Total 308.7 100% 0dash–17 nothing 24.0% 65 and older 40.3 nothing% (Type integers or decimals rounded to the nearest tenth as needed.)arrow_forwardthe following table provides the average price of regular grade gasoline for 4 years. Use 2015 as the reference value, complete the table by calculating the price index for each year. Show all your calculationarrow_forwardPlease answer b & carrow_forward
- The table below shows a recent graduate's credit card balance each month after graduation. Month 1 2 3 Debt ($) 620.00 761.88 899.80 a) Look at the graph on your calculator. Based on this graph, what type of equation should represent this situation? Explain your answer. b) Use your calculator to find the equation that you feel best fits this data. What is the equation? c) Based on this equation, what is the predicted amount of debt for month 9 after graduation?arrow_forwardplease help me with thisarrow_forwardPlease help with (d)arrow_forward
arrow_back_ios
SEE MORE QUESTIONS
arrow_forward_ios
Recommended textbooks for you
 Holt Mcdougal Larson Pre-algebra: Student Edition...AlgebraISBN:9780547587776Author:HOLT MCDOUGALPublisher:HOLT MCDOUGAL
 Big Ideas Math A Bridge To Success Algebra 1: Stu...AlgebraISBN:9781680331141Author:HOUGHTON MIFFLIN HARCOURTPublisher:Houghton Mifflin Harcourt
 Glencoe Algebra 1, Student Edition, 9780079039897...AlgebraISBN:9780079039897Author:CarterPublisher:McGraw Hill
 Algebra: Structure And Method, Book 1AlgebraISBN:9780395977224Author:Richard G. Brown, Mary P. Dolciani, Robert H. Sorgenfrey, William L. ColePublisher:McDougal Littell
Holt Mcdougal Larson Pre-algebra: Student Edition...
Algebra
ISBN:9780547587776
Author:HOLT MCDOUGAL
Publisher:HOLT MCDOUGAL
Big Ideas Math A Bridge To Success Algebra 1: Stu...
Algebra
ISBN:9781680331141
Author:HOUGHTON MIFFLIN HARCOURT
Publisher:Houghton Mifflin Harcourt
Glencoe Algebra 1, Student Edition, 9780079039897...
Algebra
ISBN:9780079039897
Author:Carter
Publisher:McGraw Hill
Algebra: Structure And Method, Book 1
Algebra
ISBN:9780395977224
Author:Richard G. Brown, Mary P. Dolciani, Robert H. Sorgenfrey, William L. Cole
Publisher:McDougal Littell
Which is the best chart: Selecting among 14 types of charts Part II; Author: 365 Data Science;https://www.youtube.com/watch?v=qGaIB-bRn-A;License: Standard YouTube License, CC-BY