Concept explainers
Videos
(a)
The models of the form
| |
|
|
|||||
| |
|
|
|
|
|
|
|
(b)
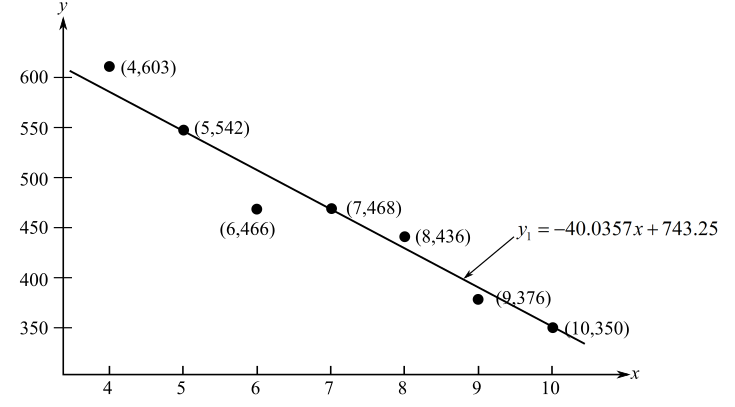
To graph: The data and each of the models
(c)
The interpretation of the slope of the linear model
| |
|
|
|||||
| |
|
|
|
|
|
|
|
The graph of the linear model is:
(d)
To calculate: The rate of change of the numbers of pancreas transplants of each of the model
Want to see the full answer?
Check out a sample textbook solution
Chapter 5 Solutions
Calculus


- Life Expectancy The following table shows the average life expectancy, in years, of a child born in the given year42 Life expectancy 2005 77.6 2007 78.1 2009 78.5 2011 78.7 2013 78.8 a. Find the equation of the regression line, and explain the meaning of its slope. b. Plot the data points and the regression line. c. Explain in practical terms the meaning of the slope of the regression line. d. Based on the trend of the regression line, what do you predict as the life expectancy of a child born in 2019? e. Based on the trend of the regression line, what do you predict as the life expectancy of a child born in 1580?2300arrow_forwardCellular Phone Subscribers The table shows the numbers of cellular phone subscribers y in millions in the United States from 2008 through 2013. Source: CTIA- The Wireless Association Year200820092010201120122013Number,y270286296316326336 (a) Find the least squares regression line for the data. Let x represent the year, with x=8 corresponding to 2008. (b) Use the linear regression capabilities of a graphing utility to find a linear model for the data. How does this model compare with the model obtained in part a? (c) Use the linear model to create a table of estimated values for y. Compare the estimated values with the actual data.arrow_forwardNoise and Intelligibility Audiologists study the intelligibility of spoken sentences under different noise levels. Intelligibility, the MRT score, is measured as the percent of a spoken sentence that the listener can decipher at a cesl4ain noise level in decibels (dB). The table shows the results of one such test. (a) Make a scatter plot of the data. (b) Find and graph the regression line. (c) Find the correlation coefficient. Is a linear model appropriate? (d) Use the linear model in put (b) to estimate the intelligibility of a sentence at a 94-dB noise level.arrow_forward
 Elementary Linear Algebra (MindTap Course List)AlgebraISBN:9781305658004Author:Ron LarsonPublisher:Cengage Learning
 Algebra and Trigonometry (MindTap Course List)AlgebraISBN:9781305071742Author:James Stewart, Lothar Redlin, Saleem WatsonPublisher:Cengage Learning
 College AlgebraAlgebraISBN:9781305115545Author:James Stewart, Lothar Redlin, Saleem WatsonPublisher:Cengage Learning
 Glencoe Algebra 1, Student Edition, 9780079039897...AlgebraISBN:9780079039897Author:CarterPublisher:McGraw Hill
 College Algebra (MindTap Course List)AlgebraISBN:9781305652231Author:R. David Gustafson, Jeff HughesPublisher:Cengage Learning
 Functions and Change: A Modeling Approach to Coll...AlgebraISBN:9781337111348Author:Bruce Crauder, Benny Evans, Alan NoellPublisher:Cengage Learning