
Concept explainers
Videos
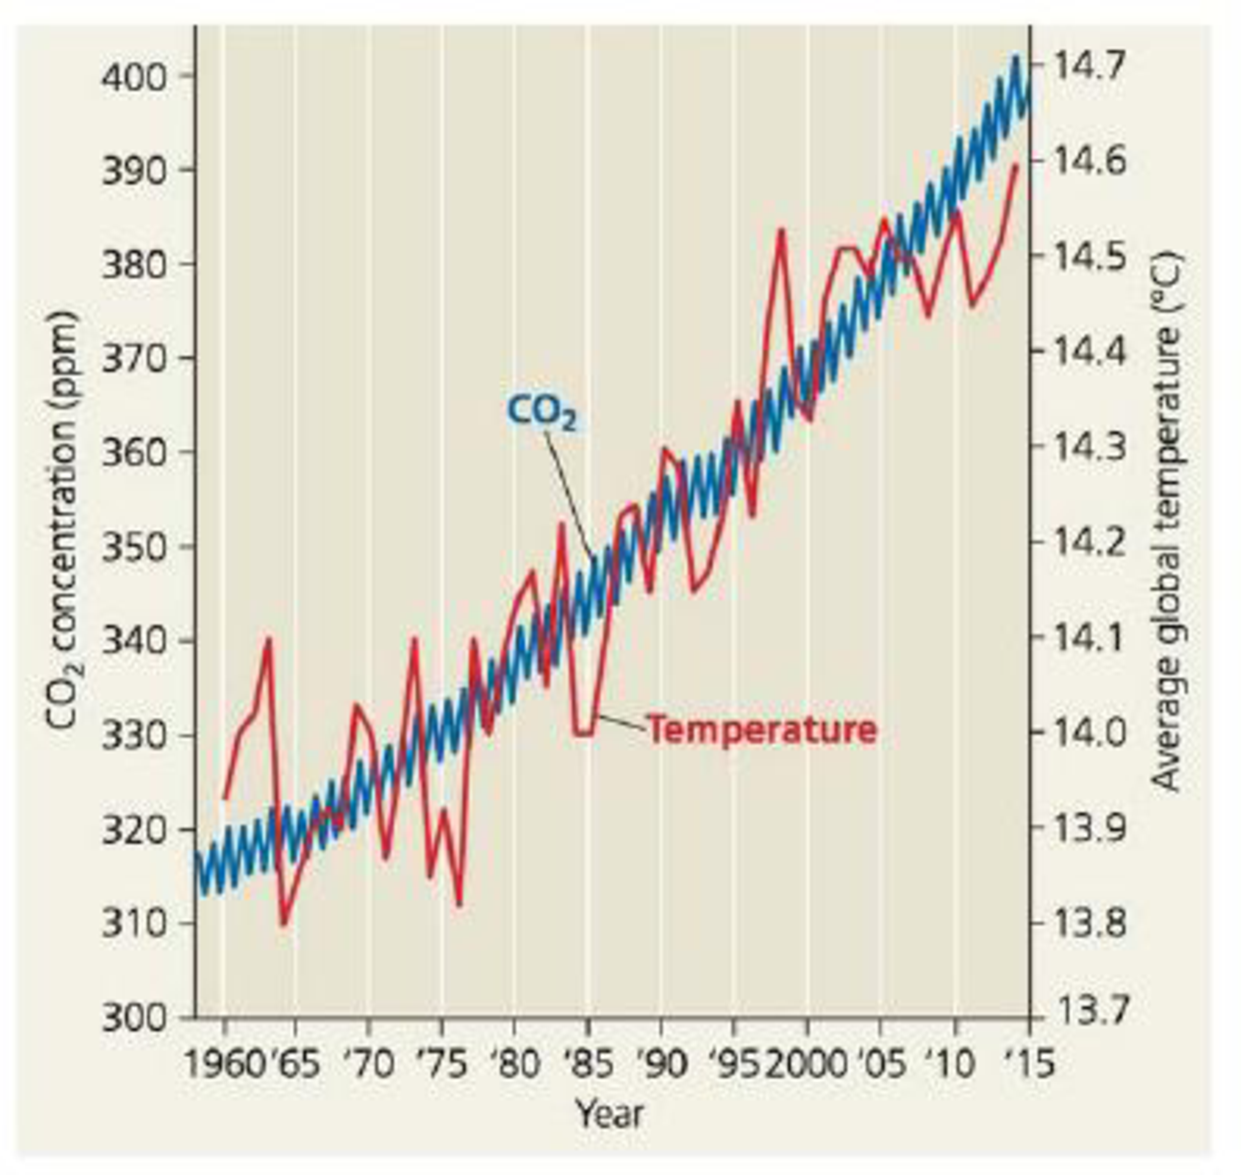
SCIENTIFIC INQUIRY (a) Estimate the average CO2. concentration in 1975 and in 2012 using data provided in Figure 56.28. (b) On average, how rapidly did CO2 concentration increase (ppm/yr) from 1975 to 2012? (c) Estimate the approximate CO2 concentration in 2100, assuming that the C02 concentration continues to rise as fast as it did from 1975 to 2012. (d) Draw a graph of average C02 concentration from 1975 to 2012 and then use a dashed line to extend the graph to the year 2100. (e) Identify the ecological factors and human decisions that might influence the actual rise in CO2. concentration. (e) Discuss how additional scientific data could help societies predict this value.
Figure 56.28 Increase in atmospheric carbon dioxide concentration at Mauna Loa, Hawaii, and average global temperatures. Aside from normal seasonal fluctuations, the CO2 concentration (blue curve) increased steadily from 1958 to 2015. Though average global temperatures (red curve) fluctuated a great deal over the same period, there is a clear warming trend.
Want to see the full answer?
Check out a sample textbook solution
Chapter 56 Solutions
EBK CAMPBELL BIOLOGY


- WIII save this response. Question 10 Which correctly describes the atmospheric cycle of CO2 concentrations in various places in the world? O the global CO2 concentration remain stable throughout the year the CO2 concentration in the southern and northern hemisphere cycle at the same time of the year O the CO2 concentration has larger annual fluctuations in the southern hemisphere because of the larger ocean area O the CO, concentration has larger annual fluctuations in the northern hemisphere because of the larger land area A Moving to another question will save this response.arrow_forwardaccording to the chart pie 1)what percentage of energy is produced by fossil fuel? 2)what percentage of energy is produced by energy technologies? 3) how much energy is produced by all alternative energy combined? U.S. energy consumption by energy source, 2017 Total 97.7 quadrillion British thermal units (Btu) Total = 11.0 quadrillion Btu geothermal 2 % solar 6% petroleum 37% - wind 21% biomass waste 4% biofuels 21% renewable energy 11% nuclear electric power 9% biomass 45% natural gas 29% wood 19% coal 14% hydroelectric 25%arrow_forwardWhat is the trend of CO2 cons in recent years?arrow_forward
- The term BOD (Biological Oxygen Demand): Group of answer choices is a measure of the organic matter and other oxygen-demanding wastes in a)a lake or stream. b)is the highest after a person eats a candy bar c)is defined as the amount of oxygen needed by fish to survive. d)is defined as the number of organisms that need oxygen in a stream. Nextarrow_forwardplease draw! Model/diagram the sources and sinks of carbon in the global ecosystem. You will need to create TWO models/diagrams of the sources and sinks of carbon. In the first model diagram the sources and sinks of carbon in a natural, pre-industrial landscape. In the second model, diagram the sources and sinks of carbon in a landscape altered by human activity and industry. Finally, write a few short sentences on what you would expect the atmospheric levels of CO2 to be in each model and why they would or would not be similar.arrow_forwardGive typing answer with explanation and conclusionarrow_forward
- provide a brief overview of the three main greenhouse gas mitigation strategies for transportation [sperling nd cannon, 2009] and discuss any four factors that could promote the adoption of electric vehicles in ghana, as outlined in laala [2019]arrow_forwardAnswer All 3 partsarrow_forwardThe following graph shows the values of radiation and photosynthesis of quelite plants (Amaranthus hybridus) measured in four days during a month. Answer the relationship between both variables and what implications they have for the adaptation of this species to radiation. Photosynthesis in (umol CO2 m-2 s-1) 100 80 40 20 O lh 1 2 3 4 Date 2100 1600 1100 600 100 -400 Radiation in (umol m-2 S-1) Photosynthesis Radiation Active photosynthetic radiation compared to Photosynthesis of Quelite in 4 different dates: 1=June 8, 2=June 25, 3=June 26 and 4-June 27arrow_forward
- H2 + 02 > H20 for which the equilibrium constant K = 627 at 150 C. Suppose 0.515 mol of H2 and 0.350 mol of 02 were placed in a 2-liter vessel at 80 C. What will the concentrations of all species be once equilibrium is established?arrow_forwardQ = Qcrit = Decision: Retain/Rejectarrow_forwardDesign an experiment to solve the following problem:Determine the rate of methanogenesis (CO2 + 4H2 S CH4 +2H2O) in anoxic lake sediments and whether or not itis H2-limited.arrow_forward
 BiochemistryBiochemistryISBN:9781305577206Author:Reginald H. Garrett, Charles M. GrishamPublisher:Cengage Learning
 Comprehensive Medical Assisting: Administrative a...NursingISBN:9781305964792Author:Wilburta Q. Lindh, Carol D. Tamparo, Barbara M. Dahl, Julie Morris, Cindy CorreaPublisher:Cengage Learning