
Concept explainers
Videos
Advanced-Stage Breast Cancer The data in the table below represent the percentage of patients who have survived after diagnosis of advanced-stage breast cancer at 6-month intervals of time.
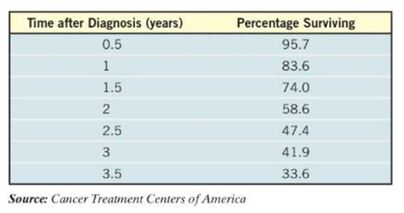
(a) Using a graphing utility, draw a
(b) Using a graphing utility, build an exponential model from the data.
(c) Express the function found in part (b) in the form .
(d) Graph the exponential function found in part (b) or (c) on the scatter diagram.
(e) What percentage of patients diagnosed with advanced-stage cancer are expected to survive for 4 years after initial diagnosis?
(f) Interpret the meaning of in the function found in part (c).
Want to see the full answer?
Check out a sample textbook solution
Chapter 5 Solutions
MYMATHLAB W/PEARSON ETEXT--18 WEEK STAN


- Compound Interest Complete the table for the time t (in years) necessary for P dollars to triple when it is invested at an interest rate r compounded (a) continuously and (b) annually.arrow_forwardExponential Decay Is the graph of exponential decay versus time increasing or decreasing?arrow_forwardSales of a video game released in the year 2000 took off at first, but then steadily slowed as time moved on. Table 4 shows the number of games sold, in thousands, from the years 20002010. a. Let x represent time in years starting with x=1 for the year 2000. Let y represent the number of games sold in thousands. Use logarithmic regression to fit a model to these data. b. If games continue to sell at this rate, how many games will sell in 2015? Round to the nearest thousand.arrow_forward
- Exponential Decay What is the concavity of a graph showing exponential decay?arrow_forwardModeling Human Height with a Logistic Function A male child is 21inches long at birth and grows to an adult height of 73inches. In this exercise, we make a logistic model of his height as a function of age. a. Use the given information to find K and b for the logistic model. b. Suppose he reaches 95 of his adult height at age 16. Use this information and that from part a to find r. Suggestion: You will need to use either the crossing-graphs method or some algebra involving the logarithm. c. Make a logistic model for his height H, in inches, as a function of his age t, in years. d. According to the logistic model, at what age is he growing the fastest? e. Is your answer to part d consistent with your knowledge of how humans grow?arrow_forward
 Algebra & Trigonometry with Analytic GeometryAlgebraISBN:9781133382119Author:SwokowskiPublisher:Cengage
 College AlgebraAlgebraISBN:9781305115545Author:James Stewart, Lothar Redlin, Saleem WatsonPublisher:Cengage Learning
 Functions and Change: A Modeling Approach to Coll...AlgebraISBN:9781337111348Author:Bruce Crauder, Benny Evans, Alan NoellPublisher:Cengage Learning
 Trigonometry (MindTap Course List)TrigonometryISBN:9781337278461Author:Ron LarsonPublisher:Cengage Learning