
Using and Understanding Mathematics: A Quantitative Reasoning Approach (6th Edition)
6th Edition
ISBN: 9780321914620
Author: Jeffrey O. Bennett, William L. Briggs
Publisher: PEARSON
expand_more
expand_more
format_list_bulleted
Videos
Textbook Question
Chapter 5.D, Problem 23E
Contour Maps. Consider the contour map in Figure 5.29, which has six points marked on it. Assume that points A and B correspond to summits and that the contour lines have 40-foot intervals.
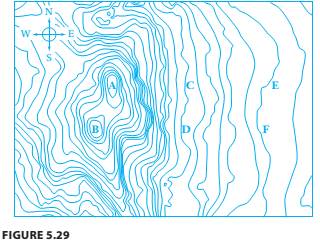
a. If you walk from A to C, do you walk uphill or downhill?
b. Does your elevation change more in walking from B to D or from D to F?
c. If you walk directly from E to F, does your elevation increase, decrease, or remain the same?
d. What is your net elevation change if you walk from A to C to D to A?
Expert Solution & Answer
Want to see the full answer?
Check out a sample textbook solution
Students have asked these similar questions
(a) Sketch lines through (0, 0) with slopes
1, 0, 1/2, 2, and −1.
Nb: draw a graph
Which of the following is number 1 on the map?
(Question #24. a,b,c,d,e)
Use graphs in picture to answer questions.
Chapter 5 Solutions
Using and Understanding Mathematics: A Quantitative Reasoning Approach (6th Edition)
Ch. 5.A - You conduct a poll in which you randomly select...Ch. 5.A - Results of the poll described in question 1 would...Ch. 5.A - When we say that a sample is representative of the...Ch. 5.A - Consider an experiment designed to test whether...Ch. 5.A - The experiment described in question 4 is a....Ch. 5.A - The purpose of a placebo is a. to prevent...Ch. 5.A - Prob. 7QQCh. 5.A - An experiment is single-blind if a. it lacks a...Ch. 5.A - Poll X predicts that Powell will receive 49% of...Ch. 5.A - A survey reveals that 12% of Americans believe...
Ch. 5.A - 1. Why do we say that the term statistics has two...Ch. 5.A - 2. Define the terms populatíon, sample, population...Ch. 5.A - Describe the five basic steps in a statistical...Ch. 5.A - Why is a so important that a statistical study use...Ch. 5.A - Prob. 5ECh. 5.A - Prob. 6ECh. 5.A - What is a placebo? Describe the placebo effect and...Ch. 5.A - What is meant by the margin of error in a survey...Ch. 5.A - In my experimental study, I used a sample that was...Ch. 5.A - I followed all the guidelines for sample selection...Ch. 5.A - I wanted to test the effects of vitamin C on...Ch. 5.A - I don’t believe the results of the experiment...Ch. 5.A - Prob. 13ECh. 5.A - By choosing my sample carefully, I can make a good...Ch. 5.A - Population and Sample. For the following studies,...Ch. 5.A - 15–20: Population and Sample. For the following...Ch. 5.A - 15–20: Population and Sample. For the following...Ch. 5.A - 15–20: Population and Sample. For the following...Ch. 5.A - Population and Sample. For the following studies,...Ch. 5.A - Population and Sample. For the following studies,...Ch. 5.A - Steps in a Study. Describe how you would apply the...Ch. 5.A - Prob. 22ECh. 5.A - Prob. 23ECh. 5.A - Steps in a Study. Describe how you would apply the...Ch. 5.A - Prob. 25ECh. 5.A - Prob. 26ECh. 5.A - Representative Sample? You want to determine the...Ch. 5.A - Representative Sample? You want to determine the...Ch. 5.A - Identify the Sampling Method. Identify the...Ch. 5.A - Identify the Sampling Method. Identify the...Ch. 5.A - Identify the Sampling Method. Identify the...Ch. 5.A - 29–34: Identify the Sampling Method. Identify the...Ch. 5.A - Identify the Sampling Method. Identify the...Ch. 5.A - Identify the Sampling Method. Identify the...Ch. 5.A - Type of Study. Determine whether the following...Ch. 5.A - Type of Study. Determine whether the following...Ch. 5.A - Type of Study. Determine whether the following...Ch. 5.A - Type of Study. Determine whether the following...Ch. 5.A - Type of Study. Determine whether the following...Ch. 5.A - Type of Study. Determine whether the following...Ch. 5.A - What Type of Study? What type of statistical study...Ch. 5.A - What Type of Study? What type of statistical study...Ch. 5.A - What Type of Study? What type of statistical study...Ch. 5.A - Prob. 44ECh. 5.A - Prob. 45ECh. 5.A - Prob. 46ECh. 5.A - Margin of Error. The following summaries of...Ch. 5.A - Prob. 48ECh. 5.A - Margin of Error. The following summaries of...Ch. 5.A - Margin of Error. The following summaries of...Ch. 5.A - Prob. 51ECh. 5.A - Prob. 52ECh. 5.A - Prob. 53ECh. 5.A - Prob. 54ECh. 5.A - Real Studies. Consider the following statistical...Ch. 5.A - Real Studies. Consider the following statistical...Ch. 5.A - Prob. 57ECh. 5.A - Prob. 58ECh. 5.A - Prob. 59ECh. 5.A - Prob. 60ECh. 5.A - Statistics in the News. Select three news stories...Ch. 5.A - 62. Statistics in Your Major. Write two to three...Ch. 5.A - Prob. 63ECh. 5.A - Prob. 64ECh. 5.A - 65. Poor Sampling. Find a new article about a...Ch. 5.A - 66. Good Sampling. Find a recent news article that...Ch. 5.A - 67. Margin of Error. Find a report of a recent...Ch. 5.A - Prob. 68ECh. 5.A - Prob. 69ECh. 5.B - You read about an issue that was the subject of an...Ch. 5.B - A study conducted by the oil company Exxon Mobil...Ch. 5.B - Consider a study designed to learn about the...Ch. 5.B - The show American Idol selects winners based on...Ch. 5.B - Consider an experiment in which you measure the...Ch. 5.B - Consider a survey in which 1000 people are asked...Ch. 5.B - Imagine that a survey of randomly selected people...Ch. 5.B - You want to know whether people prefer Smith or...Ch. 5.B - A self-selected survey is one in which a. the...Ch. 5.B - If a statistical study is carefully conducted tn...Ch. 5.B - Prob. 1ECh. 5.B - Prob. 2ECh. 5.B - Prob. 3ECh. 5.B - Prob. 4ECh. 5.B - The TV survey got more than 1 million...Ch. 5.B - Thc survey of religious beliefs suffered from...Ch. 5.B - My experiment proved beyond a doubt that vitamin C...Ch. 5.B - Everyone who jogs for exercise should try the new...Ch. 5.B - Should You Believe This Study? Based solely on the...Ch. 5.B - Should You Believe This Study? Based solely on the...Ch. 5.B - Prob. 11ECh. 5.B - 9–20: Should You Believe This Study? Based solely...Ch. 5.B - Should You Believe This Study? Based solely on the...Ch. 5.B - Should You Believe This Study? Based solely on the...Ch. 5.B - Should You Believe This Study? Based solely on the...Ch. 5.B - Should You Believe This Study? Based solely on the...Ch. 5.B - Prob. 17ECh. 5.B - Should You Believe This Study? Based solely on the...Ch. 5.B - Should You Believe This Study? Based solely on the...Ch. 5.B - Prob. 20ECh. 5.B - 21–26: Should You Believe This Claim? Based solely...Ch. 5.B - Should You Believe This Claim? Based solely on the...Ch. 5.B - Prob. 23ECh. 5.B - Prob. 24ECh. 5.B - Prob. 25ECh. 5.B - Should You Believe This Claim? Based solely on the...Ch. 5.B - Prob. 27ECh. 5.B - Prob. 28ECh. 5.B - Prob. 29ECh. 5.B - Prob. 30ECh. 5.B - Prob. 31ECh. 5.B - Prob. 32ECh. 5.B - Bias. Identify at least one potential source of...Ch. 5.B - Prob. 34ECh. 5.B - 35. Its All in the Wording. Princeton Survey...Ch. 5.B - Prob. 36ECh. 5.B - Prob. 37ECh. 5.B - Stat-Bytes. Much like sound bytes of news stories,...Ch. 5.B - Prob. 39ECh. 5.B - Prob. 40ECh. 5.B - Prob. 41ECh. 5.B - Prob. 42ECh. 5.B - Accurate Headlines? Consider the following...Ch. 5.B - 43–44: Accurate Headlines? Consider the following...Ch. 5.B - 45. What is the Question? Discuss the differences...Ch. 5.B - 46. Exercise and Dementia. A recent study in the...Ch. 5.B - Prob. 47ECh. 5.B - Prob. 48ECh. 5.B - Prob. 49ECh. 5.B - Prob. 50ECh. 5.C - Prob. 1QQCh. 5.C - For the class described in question 1, what was...Ch. 5.C - Prob. 3QQCh. 5.C - The sizes of the wedges in a pie chart tell you a....Ch. 5.C - You have a table listing ten tourist attractions...Ch. 5.C - In the table of tourist attractions and visitors...Ch. 5.C - You have a list of the GPAs of 100 college...Ch. 5.C - You have a list of the average gasoline price for...Ch. 5.C - A histogram is a. a graph that shows how some...Ch. 5.C - You have a histogram and you want to convert it...Ch. 5.C - Prob. 1ECh. 5.C - Prob. 2ECh. 5.C - Prob. 3ECh. 5.C - Prob. 4ECh. 5.C - Prob. 5ECh. 5.C - 6. What two types of graphs are most common when...Ch. 5.C - I made a frequency table with two columns, one...Ch. 5.C - The relative frequency of B grades in our class...Ch. 5.C - Prob. 9ECh. 5.C - Prob. 10ECh. 5.C - Prob. 11ECh. 5.C - Your pie chart must be wrong, because when I added...Ch. 5.C - Prob. 13ECh. 5.C - I rearranged the bars on my histogram the tallest...Ch. 5.C - Prob. 15ECh. 5.C - Frequency Tables. Make frequency table for the...Ch. 5.C - Prob. 17ECh. 5.C - Qualitative versus Quantitative. Determine whether...Ch. 5.C - Prob. 19ECh. 5.C - Qualitative versus Quantitative. Determine whether...Ch. 5.C - Qualitative versus Quantitative. Determine whether...Ch. 5.C - Qualitative versus Quantitative. Determine whether...Ch. 5.C - 17–24: Qualitative versus Quantitative. Determine...Ch. 5.C - Qualitative versus Quantitative. Determine whether...Ch. 5.C - Binned Frequency Tables. Use the given bin sizes...Ch. 5.C - Binned Frequency Tables. Use the given bin sizes...Ch. 5.C - Largest States. Make a bar graph of the...Ch. 5.C - Prob. 28ECh. 5.C - Prob. 29ECh. 5.C - Pie Charts. Construct pie charts for the following...Ch. 5.C - Oscar-Winning Actors. The following frequcncy...Ch. 5.C - 32. Teacher Salaries. The following table shows...Ch. 5.C - 13. Cell Phone Subscriptions. The following table...Ch. 5.C - Prob. 34ECh. 5.C - Prob. 35ECh. 5.C - Prob. 36ECh. 5.C - Prob. 37ECh. 5.C - Prob. 38ECh. 5.C - Prob. 39ECh. 5.C - Prob. 40ECh. 5.C - Prob. 41ECh. 5.C - Prob. 42ECh. 5.C - Prob. 43ECh. 5.C - Alcohol-Related Motor Vehicle Fatalities. Figure...Ch. 5.C - Prob. 45ECh. 5.C - Prob. 46ECh. 5.C - Prob. 47ECh. 5.C - Prob. 48ECh. 5.C - 49. Bar Graph. Find a recent news article tha...Ch. 5.C - 50. Pie Chart. Find a recent news article that...Ch. 5.C - 51. Histogram. Find a recent news article that...Ch. 5.C - 52. Line Chart. Find a recent news article that...Ch. 5.C - 53. Making a Frequency Table. The following...Ch. 5.C - Prob. 54ECh. 5.C - Prob. 55ECh. 5.C - Prob. 56ECh. 5.C - Prob. 57ECh. 5.D - Prob. 1QQCh. 5.D - Prob. 2QQCh. 5.D - Consider Figure 5.16. According to this graph,...Ch. 5.D - Prob. 4QQCh. 5.D - Prob. 5QQCh. 5.D - Prob. 6QQCh. 5.D - Prob. 7QQCh. 5.D - Prob. 8QQCh. 5.D - 9. Consider Figure 5.22(a). Moving one tick mark...Ch. 5.D - 10. Consider Figure 5.23(a). In years where the...Ch. 5.D - Briefly describe the construction and use of...Ch. 5.D - What are geographical data? Briefly describe at...Ch. 5.D - What are three-dimensional graphics? Explain the...Ch. 5.D - What are infographics, and what is their goal?Ch. 5.D - Prob. 5ECh. 5.D - 6. What is an exponential scale? When is an...Ch. 5.D - Explain how a graph that shows percentage change...Ch. 5.D - Prob. 8ECh. 5.D - My bar chart contains more information than yours,...Ch. 5.D - 10. I used an exponential scale because the data...Ch. 5.D - Prob. 11ECh. 5.D - A graph showing the yearly rate of increase in the...Ch. 5.D - 13. Net Grain Production. Net grain production is...Ch. 5.D - Education and Earnings. Examine Figure 5.l2(a),...Ch. 5.D - 15. Education and Earnings. Examine Figure...Ch. 5.D - Gender and Test Scores. Consider the data...Ch. 5.D - Gender and Test Scores. Consider the data...Ch. 5.D - Prob. 18ECh. 5.D - College Costs Stack Plot. Answer the following...Ch. 5.D - College Degrees. Figure 5.26 shows the numbers of...Ch. 5.D - Federal Spending. Figure 5.27 shows the major...Ch. 5.D - Melanoma Mortality. Figure 5.28 shows the female...Ch. 5.D - Contour Maps. Consider the contour map in Figure...Ch. 5.D - Prob. 24ECh. 5.D - Prob. 25ECh. 5.D - Prob. 26ECh. 5.D - Prob. 27ECh. 5.D - Three-DimensionaI Pies. The pie charts in Figure...Ch. 5.D - Prob. 29ECh. 5.D - Prob. 30ECh. 5.D - Cell Phone Users. The following table shows the...Ch. 5.D - Prob. 32ECh. 5.D - World Population. Recast the population data in...Ch. 5.D - Prob. 34ECh. 5.D - HIV Distribution. Figure 5.36 displays the wealth...Ch. 5.D - Creating Graphics. Make a graphical display of the...Ch. 5.D - Prob. 37ECh. 5.D - Prob. 38ECh. 5.D - 36-40: Creating Graphics. Make a graphical display...Ch. 5.D - Prob. 40ECh. 5.D - Prob. 41ECh. 5.D - Prob. 42ECh. 5.D - Prob. 43ECh. 5.D - Prob. 44ECh. 5.D - Prob. 45ECh. 5.D - 46. Interactive Infographics. Find a few examples...Ch. 5.E - If X is correlated with Y, a. X causes Y. b....Ch. 5.E - Prob. 2QQCh. 5.E - If the points on a scatterplot fall on a nearly...Ch. 5.E - If the points on a scatterplot fall into a broad...Ch. 5.E - When can you rule out the possibility that changes...Ch. 5.E - What type of correlation would you expect between...Ch. 5.E - You have found a higher rate of birth defects...Ch. 5.E - Based on the data in Figure 5.38, abou how much...Ch. 5.E - Which of the following statements best describes...Ch. 5.E - A finding by a jury that a pcrson is guilty...Ch. 5.E - What is a correlation? Give three examples of...Ch. 5.E - What is a scatterplot, and how is one made? How...Ch. 5.E - Prob. 3ECh. 5.E - Describe the three general categories of...Ch. 5.E - 5. Briefly describe each of the six guidelines...Ch. 5.E - Briefly describe three levels of confidence in...Ch. 5.E - There is a strong negative correlation between the...Ch. 5.E - There is a strong positive correlation between the...Ch. 5.E - I found a nearly perfect positive correlation...Ch. 5.E - I found a nearly perfect negative correlation...Ch. 5.E - I had originally suspected that an increase in...Ch. 5.E - Prob. 12ECh. 5.E - Interpreting Scatterplots. Consider the following...Ch. 5.E - Prob. 14ECh. 5.E - Interpreting Scatterplots. Consider the following...Ch. 5.E - 13–16: Interpreting Scatterplots. Consider the...Ch. 5.E - Types of Correlation. For the following pairs of...Ch. 5.E - Types of Correlation. For the following pairs of...Ch. 5.E - Types of Correlation. For the following pairs of...Ch. 5.E - Types of Correlation. For the following pairs of...Ch. 5.E - 17–24: Types of Correlation. For the following...Ch. 5.E - Types of Correlation. For the following pairs of...Ch. 5.E - 17–24: Types of Correlation. For the following...Ch. 5.E - Types of Correlation. For the following pairs of...Ch. 5.E - Making Satterplots. Consider the following data...Ch. 5.E - Making Satterplots. Consider the following data...Ch. 5.E - Making Satterplots. Consider the following data...Ch. 5.E - Prob. 28ECh. 5.E - Making Satterplots. Consider the following data...Ch. 5.E - Making Satterplots. Consider the following data...Ch. 5.E - Federal Aid and Representation. For each of 31...Ch. 5.E - Correlation and Causality. Consider the following...Ch. 5.E - Correlation and Causality. Consider the following...Ch. 5.E - Correlation and Causality. Consider the following...Ch. 5.E - Correlation and Causality. Consider the following...Ch. 5.E - Correlation and Causality. Consider the following...Ch. 5.E - Prob. 37ECh. 5.E - 38. Identifying Causes: Headaches. You are trying...Ch. 5.E - 39. Smoking and Lung Cancer. There is a strong...Ch. 5.E - Prob. 40ECh. 5.E - Prob. 41ECh. 5.E - Prob. 42ECh. 5.E - Prob. 43ECh. 5.E - Prob. 44ECh. 5.E - Prob. 45ECh. 5.E - Prob. 46ECh. 5.E - Prob. 47ECh. 5.E - Prob. 48E
Knowledge Booster


Learn more about
Need a deep-dive on the concept behind this application? Look no further. Learn more about this topic, subject and related others by exploring similar questions and additional content below.Similar questions
- Find the distance between the indicated points of Figure 39-10. a. Point A to point B b. Point F to point C c. Point B to point C d. Point D to point Earrow_forwardSundials The Moorish sundial is designed so that the shadow of the gnomon (the vertical triangular piece) is consistent at each hour from one day to the next. This allows the hours to be marked on the sundial using a single scale that is not affected by the changes in the Suns path during the year. If the sundial is positioned so that the gnomon is aligned along a longitudinal line from north to south, then at exactly noon the gnomon will cast a shadow due north. Figure 7 As the sun moves, the shadow will sweep out an angle toward the east, labeled in Figure 7, called the shadow angle. This angle can be calculated using the formula tan=sintan(h15) where is the latitude of the position of the sundial and h is a number of hours from noon. The latitude of Goose Pimple Junction,w Virginia, is 36.597. Find the shadow angle for a sundial in this town at 5:00 p.m. Round to the nearest tenth of a degree.arrow_forwardUse the information given in Figure 1 to find x, h, s, and r if y=3. (Note: s is the distance from A to D. and y is the distance from D to B .)arrow_forward
- Given the triangle ABC, let u= CA/2+ CB/3. (a) Explain why there is and is unique the point X on the line AB such that CX//u (Figure ). (b) Show that X belongs to segment AB and express CX as a function of CA, CB. Answer: Figure 2arrow_forward1. Graph the image of each shape using the translation givenarrow_forwardA point A (x,y) is translated 7 units to the left and 2 units up. What is the mapping to the new point A?arrow_forward
- Question 20 B? C? D? Show graphs as well.arrow_forwardSuppose the professor wants the scores to be curved in a way that results in the following: Top 10% of scores receive an A Bottom 10% of scores receive an F Scores between the 70th and 90th percentile receive a B Scores between the 30th and 70th percentile receive a C Scores between the 10th and 30th percentile receive a D Find the range of scores that would qualify for each grade under this plan.arrow_forwardThe question is apart of an imagearrow_forward
- Consider the figure below. Triangle A'B'C' is a projection of triangle АВС. Points C, C', and Q are on the same line. Points A, A', and Q are on the same line Points B, B', and Q are on the same line. Points T, V, and P are on the same line. Points W, S, and M are on the same line. Points A', C' and P are on the same line. Points A, C, and P are on the same line. [image attached] Which of the following is the axis of perspective? a) Line B'Q b) Line A'Q c) Line WQ d) Line C'P e) Line AP f) Line VParrow_forwardAccording to the graph part c,d,e, and farrow_forwardsubject: discrete structures there may be several correct answers Find ?(?) and ?(?) for the graph in Fig.5.arrow_forward
arrow_back_ios
SEE MORE QUESTIONS
arrow_forward_ios
Recommended textbooks for you
 Mathematics For Machine TechnologyAdvanced MathISBN:9781337798310Author:Peterson, John.Publisher:Cengage Learning,
 Trigonometry (MindTap Course List)TrigonometryISBN:9781305652224Author:Charles P. McKeague, Mark D. TurnerPublisher:Cengage Learning
 Holt Mcdougal Larson Pre-algebra: Student Edition...AlgebraISBN:9780547587776Author:HOLT MCDOUGALPublisher:HOLT MCDOUGAL
 College Algebra (MindTap Course List)AlgebraISBN:9781305652231Author:R. David Gustafson, Jeff HughesPublisher:Cengage Learning
 Algebra & Trigonometry with Analytic GeometryAlgebraISBN:9781133382119Author:SwokowskiPublisher:Cengage
Mathematics For Machine Technology
Advanced Math
ISBN:9781337798310
Author:Peterson, John.
Publisher:Cengage Learning,
Trigonometry (MindTap Course List)
Trigonometry
ISBN:9781305652224
Author:Charles P. McKeague, Mark D. Turner
Publisher:Cengage Learning
Holt Mcdougal Larson Pre-algebra: Student Edition...
Algebra
ISBN:9780547587776
Author:HOLT MCDOUGAL
Publisher:HOLT MCDOUGAL
College Algebra (MindTap Course List)
Algebra
ISBN:9781305652231
Author:R. David Gustafson, Jeff Hughes
Publisher:Cengage Learning
Algebra & Trigonometry with Analytic Geometry
Algebra
ISBN:9781133382119
Author:Swokowski
Publisher:Cengage
What is a Relation? | Don't Memorise; Author: Don't Memorise;https://www.youtube.com/watch?v=hV1_wvsdJCE;License: Standard YouTube License, CC-BY
RELATIONS-DOMAIN, RANGE AND CO-DOMAIN (RELATIONS AND FUNCTIONS CBSE/ ISC MATHS); Author: Neha Agrawal Mathematically Inclined;https://www.youtube.com/watch?v=u4IQh46VoU4;License: Standard YouTube License, CC-BY