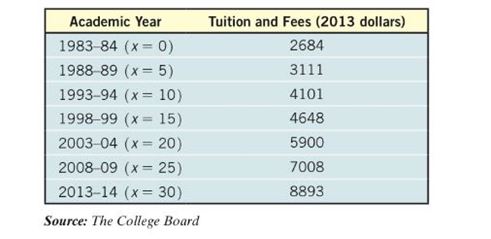
Rising Tuition The following data represent the average in-state tuition and fees (in 2013 dollars) at public four- year colleges and universities in the United States from the academic year 1983 84 to the academic year 2013 14. (a) Using a graphing utility, draw a scatter diagram with academic year as the independent variable. (b) Using a graphing utility, build an exponential model from the data. (c) Express the function found in part (b) in the form A ( t ) = A 0 e k t . (d) Graph the exponential function found in part (b) or (c) on the scatter diagram. (e) Predict the academic year when the average tuition will reach $ 12 , 000 .
Rising Tuition The following data represent the average in-state tuition and fees (in 2013 dollars) at public four- year colleges and universities in the United States from the academic year 1983 84 to the academic year 2013 14. (a) Using a graphing utility, draw a scatter diagram with academic year as the independent variable. (b) Using a graphing utility, build an exponential model from the data. (c) Express the function found in part (b) in the form A ( t ) = A 0 e k t . (d) Graph the exponential function found in part (b) or (c) on the scatter diagram. (e) Predict the academic year when the average tuition will reach $ 12 , 000 .
Rising Tuition The following data represent the average in-state tuition and fees (in 2013 dollars) at public four- year colleges and universities in the United States from the academic year 1983 84 to the academic year 2013 14.
(a) Using a graphing utility, draw a scatter diagram with academic year as the independent variable.
(b) Using a graphing utility, build an exponential model from the data.
(c) Express the function found in part (b) in the form
.
(d) Graph the exponential function found in part (b) or (c) on the scatter diagram.
(e) Predict the academic year when the average tuition will reach
.
Definition Definition Representation of the direction and degree of correlation in graphical form. The grouping of points that are plotted makes it a scatter diagram. A line can be drawn showing the relationship based on the direction of points and their distance from each other.
University Calculus: Early Transcendentals (3rd Edition)
Knowledge Booster
Learn more about
Need a deep-dive on the concept behind this application? Look no further. Learn more about this topic, calculus and related others by exploring similar questions and additional content below.
Correlation Vs Regression: Difference Between them with definition & Comparison Chart; Author: Key Differences;https://www.youtube.com/watch?v=Ou2QGSJVd0U;License: Standard YouTube License, CC-BY
Correlation and Regression: Concepts with Illustrative examples; Author: LEARN & APPLY : Lean and Six Sigma;https://www.youtube.com/watch?v=xTpHD5WLuoA;License: Standard YouTube License, CC-BY


 Algebra & Trigonometry with Analytic GeometryAlgebraISBN:9781133382119Author:SwokowskiPublisher:Cengage
 Algebra and Trigonometry (MindTap Course List)AlgebraISBN:9781305071742Author:James Stewart, Lothar Redlin, Saleem WatsonPublisher:Cengage Learning
 Big Ideas Math A Bridge To Success Algebra 1: Stu...AlgebraISBN:9781680331141Author:HOUGHTON MIFFLIN HARCOURTPublisher:Houghton Mifflin Harcourt
 Functions and Change: A Modeling Approach to Coll...AlgebraISBN:9781337111348Author:Bruce Crauder, Benny Evans, Alan NoellPublisher:Cengage Learning
 College Algebra (MindTap Course List)AlgebraISBN:9781305652231Author:R. David Gustafson, Jeff HughesPublisher:Cengage Learning