
To find: the probability that a randomly selected x-value from the distribution is in the given interval
Given information:
The given interval is: Between 57 and 72
A
Concept Used:
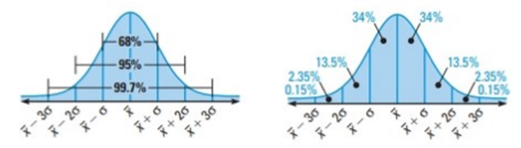
Areas under a Normal Curve
A normal distribution with mean
- The total area under the related normal curve is 1.
- About 68% of the area lies within 1 standard deviation of the mean.
- About 95% of the area lies within 2 standard deviation of the mean.
- About 99.7% of the area lies within 3 standard deviation of the mean.
Explanation:
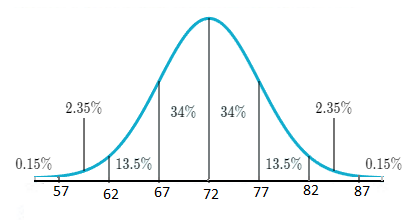
The normal distribution curve for the given distribution with mean
The required interval of between 57 and 72 represents the shaded area under the normal curve (it is the area that lies between
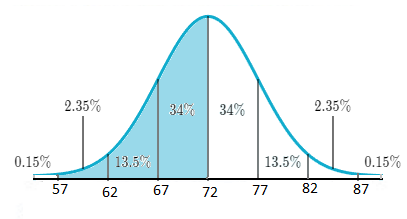
So, the probability that a randomly selected x-value from the distribution is in the given interval is:
Chapter 6 Solutions
Holt Mcdougal Larson Algebra 2: Student Edition 2012

 Algebra and Trigonometry (6th Edition)AlgebraISBN:9780134463216Author:Robert F. BlitzerPublisher:PEARSON
 Contemporary Abstract AlgebraAlgebraISBN:9781305657960Author:Joseph GallianPublisher:Cengage Learning
 Linear Algebra: A Modern IntroductionAlgebraISBN:9781285463247Author:David PoolePublisher:Cengage Learning
 Algebra And Trigonometry (11th Edition)AlgebraISBN:9780135163078Author:Michael SullivanPublisher:PEARSON
 Introduction to Linear Algebra, Fifth EditionAlgebraISBN:9780980232776Author:Gilbert StrangPublisher:Wellesley-Cambridge Press
 College Algebra (Collegiate Math)AlgebraISBN:9780077836344Author:Julie Miller, Donna GerkenPublisher:McGraw-Hill Education