
To make: A histogram for the given binomial experiment and find the most likely number of success. Also describe the distribution as symmetric or skewed.

Most likely number of success is 3.
Shape of the distribution is symmetric.
Given information:
Number of trials, and probability of success is given as follows:
Formula used:
Formula of Binomial distribution of
The most likely sum will be the
Shape of the distribution will be symmetric if left half of the distribution is the mirror image of right half.
Shape of the distribution will be skewed if the distribution is not symmetric about any vertical line.
Calculation:
Use the formula
| Binomial distribution | |
| 0 | 0.015625 |
| 1 | 0.09375 |
| 2 | 0.234375 |
| 3 | 0.3125 |
| 4 | 0.234375 |
| 5 | 0.09375 |
| 6 | 0.015625 |
Draw the histogram for the binomial experiment as shown:
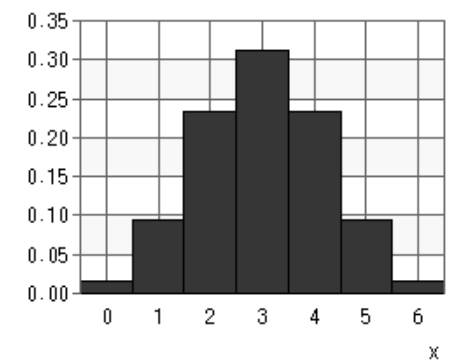
Probability corresponding to 3 success is greatest so the most likely number of success is 3.
Shape of the distribution will symmetric since the left half of the distribution is mirror image of the right half about a vertical line.
Chapter 6 Solutions
Holt Mcdougal Larson Algebra 2: Student Edition 2012

 Algebra and Trigonometry (6th Edition)AlgebraISBN:9780134463216Author:Robert F. BlitzerPublisher:PEARSON
 Contemporary Abstract AlgebraAlgebraISBN:9781305657960Author:Joseph GallianPublisher:Cengage Learning
 Linear Algebra: A Modern IntroductionAlgebraISBN:9781285463247Author:David PoolePublisher:Cengage Learning
 Algebra And Trigonometry (11th Edition)AlgebraISBN:9780135163078Author:Michael SullivanPublisher:PEARSON
 Introduction to Linear Algebra, Fifth EditionAlgebraISBN:9780980232776Author:Gilbert StrangPublisher:Wellesley-Cambridge Press
 College Algebra (Collegiate Math)AlgebraISBN:9780077836344Author:Julie Miller, Donna GerkenPublisher:McGraw-Hill Education