
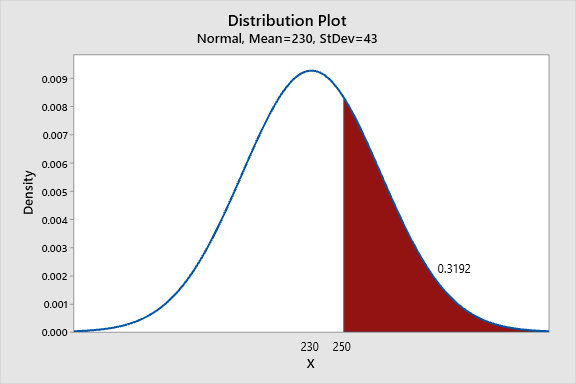
a)
To find: The area that shows the passing scores under the normal curve.
The area is 0.3192.
Given information:
Formula used:
The formula of the z-score is:
Calculation:
Consider, X be the random variable that is distributed normally.
The probability is calculated as:
The required probability is 0.3192.
Graph:
The graph is:
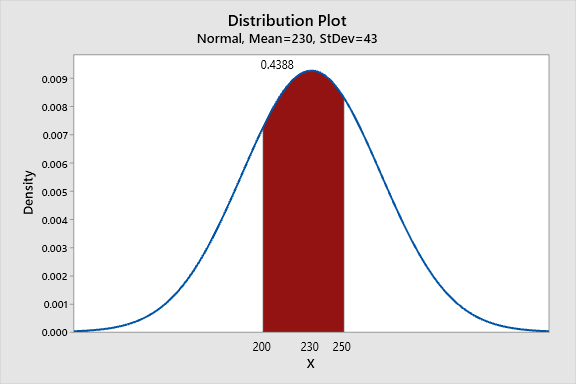
b)
To find: The area for the scores between 200 and 250. Also, display it.
The area is 0.4388.
Calculation:
Consider, X be the random variable that is distributed normally.
The probability is calculated as:
The required area is 0.4388.
Graph:
The graph is:
Chapter 6 Solutions
Holt Mcdougal Larson Algebra 2: Student Edition 2012

 Algebra and Trigonometry (6th Edition)AlgebraISBN:9780134463216Author:Robert F. BlitzerPublisher:PEARSON
 Contemporary Abstract AlgebraAlgebraISBN:9781305657960Author:Joseph GallianPublisher:Cengage Learning
 Linear Algebra: A Modern IntroductionAlgebraISBN:9781285463247Author:David PoolePublisher:Cengage Learning
 Algebra And Trigonometry (11th Edition)AlgebraISBN:9780135163078Author:Michael SullivanPublisher:PEARSON
 Introduction to Linear Algebra, Fifth EditionAlgebraISBN:9780980232776Author:Gilbert StrangPublisher:Wellesley-Cambridge Press
 College Algebra (Collegiate Math)AlgebraISBN:9780077836344Author:Julie Miller, Donna GerkenPublisher:McGraw-Hill Education