
Videos
In addition to the key words, you should also be able to define each of the following terms:
descriptive research strategy
linear relationship
curvilinear relationship
positive relationship
correlational research strategy
experimental research strategy
quasi-experimental research strategy
nonexperimental research strategy
selection bias
volunteer bias
novelty effect
multiple treatment interference
sensitization, or assessment sensitization, or pretest
sensitization
participant variables
time-related variables
fatigue
practice
artifact
experimenter bias
single-blind
double-blind
demand characteristics
reactivity
laboratory
field
To define:
The following terms:
- Descriptive Research Strategy
- Linear relationship
- Curvilinear Relationship
- Positive Relationship
- Negative Relationship
- Correlational Research Strategy
- Experimental Research Strategy
- Quasi-Experimental Research Strategy
- Non-Experimental Research Strategy
- Selection Bias
- Volunteer Bias
- Novelty Effect
- Multiple Treatment Interference
- Sensitization/Assessment Sensitization/ Pretest Sensitization
- Participant Variable
- Time-Related Variable
- Fatigue
- Practice
- Artifact
- Experimenter Bias
- Single-Blind
- Double-Blind
- Demand Characteristics
- Reactivity
- Laboratory
- Field
Explanation of Solution
Descriptive Research Strategy:
This strategy gives the description of single variable, that is, how it is varying according to time or situation. In other words, one can say that this is a strategy which is used in research to describe the variables. This strategy is used to know the behaviour of any variable and does not work for the causes behind the variation in it.
Linear relationship:
A linear relationship between any two variables can be defined as the relationship which can be represented by a line on a graph. Mathematically, a relationship between the variables x and y which satisfies the equation-
Where m is a slope and c represents intercept.
Curvilinear Relationship:
If the linear relationship does not exist between two variables then there would be another relationship, known as a curvilinear relationship, that is, the relationship except the linear relationship between the two variables is known as curvilinear relationship.
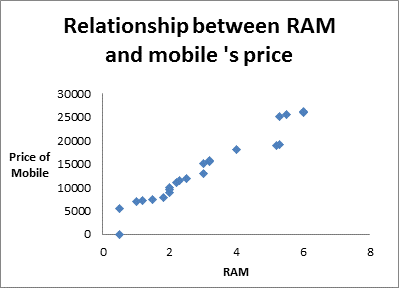
Positive Relationship:
In statistics, a positive relationship or positive correlation is defined as the relationship between two variables in which, increment (decrement) in one variable results in increment(decrement) of other variable (not necessarily in same ratio). In other words, positive relationship is the relationship between the two variables in which both variable moves in same direction.
For example, increment in RAM results in increment in price of mobile. The positive relationship can also be seen graphically through scatter plot.
Negative Relationship:
In statistical terms, a negative relationship or negative correlation is defined as the relationship between two variables in which both the variables move in opposite direction, that is, increment(decrement) in the value of one variable results in decrement (increment) of other.
For example, on increasing the temperature of microwave, the time taken by water to boil is decreased.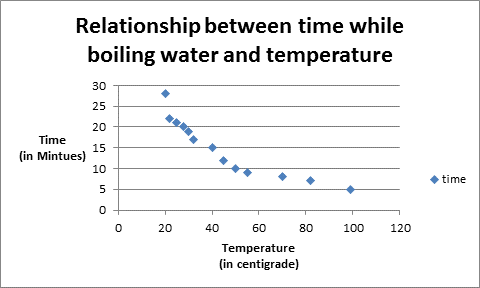
Correlational Research Strategy:
The research strategy used to find the relationship between two variables is known as correlational research strategy. It tells whether the relationship exists or not and if exists then which kind of relationship exists, that is, the nature of relationship. It can be seen by scatter plot which is a graphical representation of variables. Correlation is not same as causation.
Experimental Research Strategy:
The research study which gives the cause and effect relationship between the two variables is known as experimental research strategy. In this type of study, one does changes in a variable which is known as independent variable and the dependent variable is measured at different levels of the independent variable and the remaining variables are known as extraneous variables. Here, manipulation in independent variable is used to determine the direction of a relationship and comparison of dependent variable is done at each level of treatment and one controls the effect of extraneous variables as much as possible through randomization technique.
Quasi-Experimental Research Strategy:
A quasi-experimental research strategy is not a true experimental research strategy but it is between correlational and experimental research strategy. In this strategy, the problem of controlling extraneous variable is not eliminated but the problem of directionality is solved. In this, participants are not randomly assigned to experimental groups.
Non-Experimental Research Strategy:
A research strategy in which independent variable cannot be manipulated or random assignment is not possible is known as non-experimental research strategy. In this type of study, sometimes one has to deal with a problem of single variable or the problem of non causal relationship between variables or the problem may be about a particular experience. Some kinds of non-experimental research are correlational research, quasi-experimental research, single-variable research and qualitative research.
Selection Bias:
As the name 'selection bias' sounds that it is the bias in selection, that is, when the selection of units is not done randomly then it is not a good representative of population and it affects the analysis. So, the main purpose of analysis is not fulfilled when the units in the sample are not chosen randomly. For example, sometimes in interviews, the interviewer do bias in selecting candidates.
Volunteer Bias:
A volunteer bias occurs when the when sample members are self-selected. For example, if teacher asks to students to participate in sports event, then some of the students come to teacher and tell that they want to participate in sports event then they are volunteers and here randomization does not play any role so this type of bias is known as selection bias.
Novelty Effect:
Novelty effect arises due to something new which means that when there is an effect of any new thing occurs or changes in environment then people get boosted for some time and there will be novelty effect. For example, when the online shopping apps came into our lives then suddenly people love to use those apps because of saving of time and some other reasons. The people got attract to online shopping and this was the change for them. So, here the novelty effect kicked in.
Multiple Treatment Interference:
When the multiple treatments are given to the same subjects and effect of one treatment may be influenced by other treatment, this process is known as multiple treatment interference.
Sensitization/Assessment Sensitization/ Pretest Sensitization:
Sensitization is the process of making someone react to something that previously had no effect or in other words, the process of being sensitive towards any specific event.
When the participants involved in the experiment are pretested then there is a risk that they will be sensitive towards the variables which is measured by pretesting and that will affect their post-test scores, this is pretest sensitization.
Participant Variable:
Participant variables are the extraneous variables which describe the individual's characteristics that may impact how he or she responds such as age, anxiety, awareness or intelligence etc. These are known as extraneous variables because these variables can affect the experiment but the experimenter may not consider it.
Time-Related Variable:
It is clear by the name 'time-related variable' that the variables which varies with the time such as price of mobiles, temperature over a day etc. These types of variables are very useful in time-series analysis and in research study too.
Fatigue:
Fatigue means extreme tiredness which occurs without taking rest over a period of time whether from physical or mental illness. Fatigue is a process that has a degree of randomness and is influenced by variety of factors. The most common distributions in data analysis which works against fatigue are Weibull distribution, lognormal distribution and extreme value distribution.
Practice:
It is a threat to internal validity that occurs when prior participation in a measurement provides additional skills that influence their performance on subsequent measurements.
Artifact:
In statistics, artifact is a noise or error which occurs during data manipulation or in the case of selection of faulty choice of variables. It threats the validity of measurement and is an external factor.
Experimenter Bias:
During an experiment, the thoughts of a researcher affect the experiment and it can occur at any phase of research. This is known as experimenter bias. It is very difficult to leave subjectivity completely for anyone because of which this bias arises.
Single-Blind:
When a researcher gives any treatment or medication to a subject and that subject is not aware about the treatment or medication which he/she is receiving is known as single-blind study.
Double-Blind:
When a subject as well as researcher is not aware of the treatment then the study is called as double-blind study. This type of study is used to remove the bias by keeping both the persons unaware about what is being tested.
Demand Characteristics:
In research, demand characteristics are artifact which occurs when the subject is aware about the treatment which they are receiving and then they change their behaviour which affects the outcome of the research.
Reactivity:
Reactivity refers to the behaviour of subject which changes during the experiment when they get affected by any instrument during experiment and this may create bias.
Laboratory:
Laboratory term refers to observing the behaviour of the subject that is observed in controlled atmosphere. For example, a teacher can observe a student in a classroom which is controlled atmosphere and also in playground during holidays which is an uncontrolled atmosphere. So, as a teacher, she/he can get nearly accurate result about student in a class.
Field:
In statistics, field can be defined as the place from where one can collect primary data by using various methods such as personal interview, direct investigation etc.
Want to see more full solutions like this?
Chapter 6 Solutions
Bundle: Research Methods for the Behavioral Sciences, Loose-Leaf Version, 6th + MindTap Psychology, 1 term (6 months) Printed Access Card


- You hypothesize that there may be a non-linear relationship between your predictors, where there may be more mosquitoes in sites with water and with caribou hosts. How do you create your model? Assume that "caribou" corresponds to the presence/absence of caribou Assume that "water" corresponds to the presence/absence of water number of mosquitoes ~ caribou * water number of mosquitoes ~ caribou + water presence/absence of mosquitoes ~ caribou + water presence/absence of mosquitoes ~ caribou * waterarrow_forwardQ: Suppose we have a dataset of weather conditions and corresponding target variable "Play". So, using this dataset we need to decide that whether we should play or not on a particular day according to the weather conditions Problem: If the weather is Rainy, then the Player should play or not? Outlook play Rainy Yes Sunny Yes Overcast No Rainy No Sunny No Rainy Yes Sunny Yes Rainy Yes Rainy No Sunny Noarrow_forwardYou may need to use the appropriate technology to answer this question. Do students with higher college grade point averages (GPAs) earn more than those graduates with lower GPAs?† Consider the following hypothetical college GPA and salary data (10 years after graduation). GPA Salary ($) 2.22 72,000 2.27 48,000 2.57 72,000 2.59 62,000 2.77 86,000 2.85 98,000 3.12 133,000 3.35 130,000 3.66 157,000 3.68 162,000 (a) Develop a scatter diagram for these data with college GPA as the independent variable. A scatter diagram has a horizontal axis labeled "GPA" with values from 2 to 4 and a vertical axis labeled "Salary ($)" with values from 0 to 180,000. The scatter diagram has 10 points. A pattern goes down and right from (2.22, 122,000) to (3.68, 8,000). The points are scattered moderately from the pattern. A scatter diagram has a horizontal axis labeled "GPA" with values from 2 to 4 and a vertical axis labeled "Salary ($)" with values from 0 to 180,000. The…arrow_forward
- Your Question: Digital First Industries (DFI) is a provider of software solutions that help individuals and small businesses manage their finances. DFI recently developed and released a set of mobile applications that cater to specific customer needs (BudgetPlus, InvestorPro, SimpleSavings, PayPlan, Transact). To help identify which of these apps is most popular with customers and is worth devoting more resources to, you have been tasked with analyzing data that has been captured and creating a dashboard to track activity. Tasks: Using the data in the Monthly_App_Downloads worksheet: Create a new worksheet called App_Downloads_Reportwith the following four charts (all your charts should be formatted, labelled, and titled appropriately): A clustered column chartshowing the number of downloads for each mobile application over the course of the months from January to June. For this chart, your horizontal axis should consist of month names, and your vertical columns should be based on…arrow_forwardPlease answer C. and D. Palisades Eco-Park is a small ecological reserve that admits a relatively small number of visitors on any day, but provides both educational and entertaining lectures, exhibitions, and opportunities to observe nature. The company has collected the following data on labor costs and number of visitors to the park over the last 30 months. Month Labor Cost Visitors 1 $ 25,820 1,700 2 $ 36,290 2,592 3 $ 39,968 2,811 4 $ 31,648 2,222 5 $ 34,809 2,373 6 $ 32,672 2,181 7 $ 32,023 2,205 8 $ 38,334 2,676 9 $ 38,568 2,760 10 $ 46,933 3,572 11 $ 42,157 2,976 12 $ 39,030 2,804 13 $ 34,444 2,415 14 $ 33,173 2,336 15 $ 36,971 2,508 16 $ 26,500 2,099 17 $ 30,663 3,397 18 $ 29,961 2,786 19 $ 27,590 2,412 20 $ 30,003 2,972 21 $ 25,692 2,000 22 $ 24,655 1,794 23 $ 28,892 3,267 24 $ 30,153 3,817 25 $ 28,119 2,592 26 $ 31,690 3,274 27 $ 28,651 2,989 28 $ 29,927 3,050 29 $ 28,438 2,511 30 $ 27,874 2,075…arrow_forwardStep 4: Make decision.(Select A or B) A. Reject H0B. Retain H0 Decision = Conclusion.(Select A, B, or C) A. There is no statistical difference in recycling behavior between people who have pessimistic vs. optimistic attitudes toward eco-friendly behaviors. B. People who have pessimistic attitudes toward eco-friendly behaviors recycled significantly more often than those who have optimistic attitudes. C. People who have optimistic attitudes toward eco-friendly behaviors recycled significantly more often than those who have pessimistic attitudes. Conclusion = Effect Size. Calculate the value of the effect size using Cohen's d (NOT eta-squared). d = (use 2 dec places) Is the effect size small, medium, or large? =arrow_forward
- Suppose researchers at an abdominal transplant clinic are concerned about the rate of graft loss due to diabetes status prior to receiving a donor kidney. Research has shown that gender discordance, or receiving a gender from a donor of an opposite gender may increase the risk of both exposure and outcome after transplant. Assume the following tables represent the stratified analysis of the potential confounding variable. (9 points) Gender Discordance Graft Failure No Graft Failure Total Diabetes II 23 10 33 No Diabetes II 4 44 48 Total 27 54 81 Gender Concordance Graft Failure No Graft Failure Total Diabetes II 9 34 43 No Diabetes II 12 87 99 Total 21 121 142 A) Calculate the stratum specific estimates for the odds ratios in each strata. B) Observe the difference in the odds ratios. Based on observation alone, what are we likely to conclude regarding the relationship between outcome and exposure…arrow_forwardAn economist at Nedbank ran a study of the relationship between FTSE/JSE All Shares index return (JALSH) and consumer price index (CPI) from 2006 to 2017, the data collected is shown in the Table 1 below. FTSE/JSE All Shares index return (JALSH) and consumer price index (CPI) from 2006 to 2017. Year JALSH (Y) CPI (X) 2006 0.41 4.7 2007 0.19 7.1 2008 -0.23 11.5 2009 0.32 7.1 2010 0.19 4.3 2011 0.03 5.0 2012 0.27 5.6 2013 0.21 5.7 2014 0.11 6.1 2015 0.05 4.6 2016 0.00 6.4 2017 0.21 5.3 The estimated regression…arrow_forwardYou are a consultant to EAI and you have received the data on theannual salaries of 2500 managers. Some of these managers have alsoindicated that they have received some training. Conduct theappropriate descriptive analyses and present a report that willenable EAI to understand its operations. The link to the data is: https://drive.google.com/file/d/1KluyxHQdEsVNA38_EWPcEgKUJomm9b67/viewarrow_forward
- If we were conducting a hypothesis test to determine if there was a linear relationship between reading ability and IQ score then the research hypothesis would be? Group of answer choices: H0:ρ≠0 H1:ρ≠0 H1:r≠0 H0:r≠0arrow_forwardWhat are the key concerns of the local government? What is the quantitative method applied here, and what are the variable/s used in the model? Looking at the unique aspects of the situation, what other forecasting method will you use here? Review the quantitative methods 1-5. Review the advantages and disadvantages of these quantitative methods.arrow_forwardR Studio library(poliscidata) 2. (Dataset: nes. Variables: dhsinvolv_message, polknow_combined.) Online political activism is a relatively new phenomenon. In recent years, online social networks like Facebook and Twitter have become part of our everyday experiences and, for many people, a forum for political news and debate. From your own personal experiences, you may have some impressions about who is likely to post political messages online, but our personal perspectives are bound to be limited and incomplete. Let's use the nes dataset to gain a better understanding of who uses social media to promote political ideas. Survey participants were asked whether they had posted a political message on Facebook or Twitter in the last 4 years and the dhsinvolv_message variable recorded their responses. 1. According to the nes dataset, roughly 20% of respondents indicated that they had posted a social media message about politics in the past 4 years. If the probability of an…arrow_forward
 MATLAB: An Introduction with ApplicationsStatisticsISBN:9781119256830Author:Amos GilatPublisher:John Wiley & Sons Inc
 Probability and Statistics for Engineering and th...StatisticsISBN:9781305251809Author:Jay L. DevorePublisher:Cengage Learning
 Statistics for The Behavioral Sciences (MindTap C...StatisticsISBN:9781305504912Author:Frederick J Gravetter, Larry B. WallnauPublisher:Cengage Learning
 Elementary Statistics: Picturing the World (7th E...StatisticsISBN:9780134683416Author:Ron Larson, Betsy FarberPublisher:PEARSON
 The Basic Practice of StatisticsStatisticsISBN:9781319042578Author:David S. Moore, William I. Notz, Michael A. FlignerPublisher:W. H. Freeman
 Introduction to the Practice of StatisticsStatisticsISBN:9781319013387Author:David S. Moore, George P. McCabe, Bruce A. CraigPublisher:W. H. Freeman